2016 MLB thread. THE CUBS HAVE BROKEN THE CURSE! Chicago Cubs are your 2016 World Series champions

Status
Not open for further replies.
Why Hasn’t James Shields Been “Big Game James?”

We — and I suppose by “we,” I do mean “the people I enjoy on Twitter” — have gotten a lot of joke mileage this postseason thanks just to a few never-ending items that have been pounded into the ground by baseball media and observers. I’m talking about things like Ernie Johnson’s complete lack of emotion, the eternal Viagra ad, TBS insisting on trying to make “shutdown innings” a thing, and so on.

Included among that has been that every single time James Shields‘ name is mentioned, he’s referred to as “Big Game James,” as though it’s his legal name. Shields is a very good pitcher, but he’s picked up a certain reputation for doing well in big spots entirely because of a rhyming sound his name makes. If only he’d gone with “Jim Shields,” right?

The gag there is obvious. “Big Game James” hasn’t actually come up that big at all in the postseason. For his career, he’s got a 5.19 ERA in nine starts. Five times, he’s allowed four runs or fewer, which is great, but four of those times came way back during Tampa Bay’s 2008 run to the World Series, which is not. Between 2008 and 2014, his postseason experience consisted of being hit hard by Texas twice, allowing a combined 11 earned runs across an ALDS start in 2010 and another in 2011.

This year, he’s made three starts, and while the Royals have of course won all three, it hasn’t necessarily been thanks to him. In the wild card game, he allowed four runs and nine baserunners in five innings, including leaving a meatball of a changeup for Brandon Moss to drive out of the park. (Though Ned Yost was later crushed for his decisions in that game, the mistake was bringing in Yordano Ventura, not deciding that Shields was done.) Against the Angels in the ALDS, he was better, allowing two earned runs in six innings, though he again allowed nine baserunners, along with solo homers to Mike Trout & Albert Pujols. And in Game 1 of the ALCS against Baltimore, he allowed 11 baserunners and four runs, helping to turn what had been a 4-0 lead into a game the Royals had to win on 10th inning Alex Gordon & Mike Moustakas homers.

The Royals have been winning in ways we might not have expected, but “having your best starter underperform” isn’t exactly a welcome part of that menu. So, as Shields prepares to throw the first pitch of the World Series against Gregor Blanco and the Giants tonight, is there anything we can draw from his postseason struggles? Anything the Giants might want to keep in mind?
* * *

Let’s acknowledge the obvious: These are small sample sizes. Nine starts aren’t really that many, and in fact we’re going to be limiting that even further, since I’m not all that concerned with what 26-year-old Jamie Shields did as a Ray against the White Sox, Red Sox, and Phillies six years ago. What’s interesting to us is what he’s doing right now, and what he’s likely to do in the one or two starts he’ll get against the Giants.

And, in fact, let’s push this further back. Shields allowed three earned runs in each of his last three games of the regular season, after a stretch in which he’d allowed two earned runs in the preceding three games. In five of his last six games, he’s allowed three or more earned runs, and two of those came against the White Sox, which pushes back a bit on the “you see better teams in the postseason” theory. With the Royals variously trying to catch the Tigers in the AL Central and hold off the A’s and Mariners in the wild card race, one might conclude that those have been “big” games as well, and Shields hasn’t been a top-quality starter for most of the last month-plus.

So, what do we know about Shields? We know that a huge part of his reputation is that he’s reliable and durable, pitching at least 227 innings in each of the last four years, and at least 203 in all eight of his full big league seasons. Other than a serious 2002 shoulder injury that wiped out his age-20 season in Single-A, Shields has never been injured as a pro. He’s thrown the second-most regular season innings in baseball over the last two years, and the most over both the last three and four and so on. Since his first full season in 2007, no pitcher in baseball has thrown more regular season innings than Shields, even if that’s by only a single out more than Felix Hernandez.

There’s a ton of mileage on that arm, just over 2,500 innings as a pro, and as he nears his 33rd birthday in December, one would rightfully start to worry about the cumulative effects of tens of thousands of pitches. But velocity hasn’t really been an issue; in fact, he’s increased it, surprisingly. Shields’s 2014 average of 93.75 mph on his four-seamer is the fastest he’s had in the last five seasons, and even within the confines of this year alone, there’s no concerning velocity drop.

If you’re thinking about pitch repertoire, half of Shields’ strategy has always been to make it difficult to guess what’s coming next. For years, Shields has thrown five pitches — four- and two-seam fastballs, a change, a curve, and a cutter. (Some sources combine the fastballs and say he throws four pitches, but as usual, I’ll defer to Brooks on this one.) For the last few years, he’s been using his once-stellar curve less and less in favor of the cutter, a move that helped him, since his cutter was rated as the most valuable in the American League just last season.

It’s a change that makes sense, anyway, considering that when you look at the horizontal and vertical movement of the two pitches, they slowly became more and more similar over time:

700


But that’s not a change that happened just this season, and certainly not in the last few weeks. So instead, let’s take a deeper dive into usage, and we’ll adapt some Brooks charts to do so. In white, his pitch usage from the regular season. In blue, we have Shields in the postseason.

There’s a lot happening here. Just hang with me, it will be explained.

James Shields, 2014 ’14
season ’14
playoffs
Fourseam Sinker Cutter Curve Change
LHH
All Counts 25% 40% 15% 2% 21% 26% 15% 8% 25% 23%
First Pitch 37% 53% 19% 3% 17% 24% 20% 6% 8% 15%
Batter Ahead 34% 49% 15% 3% 24% 34% 3% 0% 25% 14%
Even 27% 46% 16% 2% 22% 25% 15% 6% 20% 21%
Pitcher Ahead 13% 24% 13% 0% 16% 21% 25% 21% 33% 35%
Two Strikes 19% 50% 16% 0% 20% 7% 9% 3% 35% 40%
RHH
All Counts 32% 28% 12% 15% 28% 33% 10% 7% 18% 17%
First Pitch 41% 23% 14% 18% 34% 53% 7% 8% 3% 0%
Batter Ahead 39% 33% 13% 19% 33% 33% 2% 0% 14% 16%
Even 32% 24% 14% 18% 29% 46% 9% 4% 15% 7%
Pitcher Ahead 25% 31% 9% 6% 23% 13% 17% 17% 26% 33%
Two Strikes 34% 39% 4% 2% 19% 13% 9% 9% 35% 38%
So what do we see there? (Yes, “a giant wall of numbers and a trip to the eye doctor” is accurate.) What really stands out is that against lefties, Shields has been using his fastball much more often overall, and higher in every situation. His two-seamer is just gone, having all but disappeared, and the curve and change have both seen considerable decreases. Of the 30 times he’s had two strikes on a lefty, 15 of them have been fastballs. Rather than trying to use the cutter, sinker, or curve as a putaway pitch, as he often did this year, it’s been all fastball and change.

There’s something to be said for avoiding predictability and keeping the other guy guessing, but Shields’ fastball has never been his meal ticket. It’s obviously great to have a fastball that comes in at 93-94 to set up the other pitches, but overall, it’s been rated as something of a negative in his two seasons in KC. As a Royal, his two plus pitches have been his cutter and his change, and even his change endured a tough 2014 before looking much better late in the season, as Jeff detailed at the end of September. It hasn’t worked wonderfully so far. Shields has thrown the fastball to nine lefties this postseason, and four of them — two singles, a walk, and a homer — ended up not turning into outs.

Against righties, he’s actually thrown the fastball less than he did in the regular season, preferring instead to throw the cutter, especially on the first pitch. (One of those fastballs was the one to Trout, who took it out of the park.) Against Pujols, the cutter just sort of fluttered up to the plate, then quickly departed the park:

700


When it’s right, the cutter is a deadly pitch. That one wasn’t, and at times this October it’s been a little less than usual, both in bite and in placement. As you can see during the regular season, that cutter mostly went down and away to righties, or down and in to lefties. In limited samples this postseason — and I hope I’ve reiterated that point enough — he’s found himself catching a bit more of the plate, particularly down and centered.

700


Shields, fresh off an uninspiring six start stretch, is still the best starter the Royals have, and there’s really nothing wrong with him, as far as we can tell. (Other than the kidney stone he apparently dealt with after his ALCS start, which prevented him from being considered on short rest for Game 4.) The cutter doesn’t seem quite so sharp right now, and his pitch selection has changed from the regular season. Either or both could be having some impacts, small as they may be, because it’s not like he’s been getting lit up.

Part of the issue might just be perception. After all, Shields is a very, very good pitcher, but few would really place him in the absolute upper echelon of aces, the level where Clayton Kershaw, Felix Hernandez, healthy versions of Chris Sale, Masahiro Tanaka, Yu Darvish and others reside; he did, after all, allow five or more runs in a game seven times this year. His FIP was tied for 40th, just behind Henderson Alvarez. His ERA, 28th. He’s a really good pitcher, just below an elite one, and his team has managed to succeed this postseason without him at his best.

They’ll take that, certainly. But will it be enough if the “just okay” Shields shows up tonight against Madison Bumgarner?

So You’re About to Pitch to Pablo Sandoval.

Hello there, Royals pitchers! Congratulations on reaching this point — you’ve done many proud. No matter what happens, your 2014 season has been a screaming success. The Royals are back on the baseball map nationally and, more importantly, locally. But of course you’re not done yet, as there’s one remaining step in the staircase: Looming in front of you are the San Francisco Giants. You’ll face many different Giants hitters; among them will be Pablo Sandoval. In case you’ve never seen him before, you’re in for an experience. I’d like to show you something. Actually, I’d like to show you two somethings. Here’s one of them:

Pablo Sandoval: 45% out-of-zone swing rate
Matt Carpenter: 46.8% in-zone swing rate
You’re going to face Sandoval; it could’ve been you would’ve faced Carpenter. Sandoval swings at about as many balls as Carpenter does strikes. For the sake of some perspective:

Pablo Sandoval: 45% out-of-zone swing rate
Salvador Perez: 44.1% out-of-zone swing rate
So that’s how aggressive this Sandoval character is. Now, you might be wondering, “Does that mean he’s as easy to get out sometimes as Salvy?” No, this Sandoval guy is a unique sort of challenge. To prepare you for the challenge to come, I’m going to provide you with some strategy tips. How should you pitch to Pablo Sandoval, if you want to get him out? Pay careful attention to my advice.

Be careful with pitches in the zone

This should be pretty obvious. You should always be careful with pitches in the zone, to everyone. Sandoval likes to swing at balls, so that means he also likes to swing at strikes. When he does that, he makes contact 86% of the time. As Baseball Savant tells us, Sandoval has slugged .564 against pitches within the PITCHf/x strike zone during his career. That’s a very good slugging percentage, so this isn’t a guy to groove many pitches against. The Giants like to hit him in the middle. Careful with strikes against guys who hit in the middle.

Be careful with pitches out of the zone

So Sandoval likes to chase. For him, it’s not really chasing — he just operates with a big personal strike zone. When Sandoval’s gone out of the PITCHf/x strike zone, he’s made contact nearly 80% of the time, which is more often than a guy like Chris Davis hits strikes. And it’s not just weak, empty contact. During the PITCHf/x era, Sandoval’s slugged .425 against pitches out of the zone, which is the highest mark in baseball. You know how most of you are right-handed? Sandoval’s a switch-hitter, too, and he’s better from the left side. From the left side, he’s slugged .452 against pitches out of the zone. On contact, that goes up to .544. The strike zone’s supposed to capture the hittable area. It doesn’t quite capture Sandoval’s.

Be careful with pitches down

We can break this into more detailed areas. It’s not like all pitches out of the zone or near the border are created alike. Want to pitch Sandoval down? Be careful. He will swing, often, but he’s slugged .439 against pitches down as a lefty, which is fourth-best in baseball. He can punish pitches that aren’t far off the ground:

700


According to Brooks Baseball, Sandoval’s made contact 80% of the time he’s gone below the zone. He can stretch those arms.

Be careful with pitches in the middle

Duh. Sandoval swings at these pitches. He doesn’t miss these pitches. Against these pitches as a lefty he’s slugged .554. Other batters have slugged better, but any slugging percentage that begins with the number five indicates that it’s a tricky area for pitchers to navigate. Lots of normal guys are dangerous thigh-high. Sandoval is abnormal, but not in that way.

Be careful with pitches up

Some guys who excel at hitting the low ball can be exposed up top. Sandoval’s not really one of them. As a lefty, against pitches up, he’s slugged .495, which is the 10th-best mark in baseball. I mean:

700


There’s an area up there where Sandoval becomes likely to swing and miss. Out of the zone, up, Sandoval’s missed with one out of every three attempts. But he still packs a wallop, and to get him to miss you have to really climb the ladder. If you miss at all below the target you could be whipping around in a hurry. The safe spot is surrounded by dangerous spots, which makes the whole area a dangerous spot.

Be careful with pitches in

Not a lot of pitchers work Sandoval inside when he bats as a lefty, and there’s a good reason for that.

700


Sandoval doesn’t often whiff when he swings inside. As a lefty, he’s slugged .530 against inside pitches, as he’s blessed with quick wrists that let him get the bat head out in front. This, of course, applies to both inside strikes and inside balls. The pitch you see above was an inside ball. If you’re trying to pitch him right under the hands, good luck. Those hands move around.

Be careful with pitches away

Here’s a fun fact: As a lefty, Sandoval’s slugged .472 against pitches away. That’s 22nd-best in baseball, even with one Prince Fielder. Pitchers routinely target areas away, as they tend to do against mostly opposite-handed hitters. Just as Sandoval can turn on a pitch in, he can smack a pitch away to the opposite field, seemingly without any problem.

700


Sandoval’s least likely to swing at pitches out of the zone, away, but he’ll still chase and he’s still made contact with those pitches 80% of the time. If you’re pitching to Sandoval, all your defenders need to be paying attention, because he can cover the entire field.

Be careful with fastballs

Against fastballs and cutters, Sandoval has been 57 runs better than average for his career. To put that in more familiar terms: He’s hit .302 and slugged .502, with both marks even better left-handed. He’s made contact better than 80% of the time. Sandoval can slap fastballs, and he can also turn on them, depending on the location.

Be careful with off-speed pitches

Against off-speed pitches, Sandoval has been 20 runs better than average for his career. To put that in more familiar terms: He’s hit .319 and slugged .473, with both marks similar left-handed. He’s made contact 84% of the time, which is even better than his fastball contact rate. That’s the hallmark of someone who’s able to make an on-the-fly adjustment.

Be careful with breaking balls

Against breaking balls, Sandoval has been four runs better than average for his career. To put that in more familiar terms: He’s hit .272 and slugged .419, with both marks better left-handed. He’s made contact 82% of the time, which is also better than his fastball contact rate. While Sandoval has been worse against breaking balls than against other pitch types, he’s one of the relatively few players to be better than average against all three types. If you’re not careful with your slider or curve, Sandoval’s more than capable of drilling it.

Be careful with two strikes

With some players, when you get them into a two-strike count, you all but already have them beat. With Sandoval, it’s not so. Since he debuted, the average player has hit .182 and slugged .274 with two strikes. Sandoval has hit .221 and slugged .338, and this year he hit six home runs. Players are at their most aggressive when they’re a strike away from a whiff. For some, that’s a departure from their comfort zone, but Sandoval is naturally so aggressive anyway that two strikes don’t seem to bother him, relatively speaking. You could say he’s always hitting like he has a two-strike count.

==========

So what do we have here? Some kind of impossible player to get out? Not really. Sandoval’s career OBP is .346. This year it was .324. Most of the time, Sandoval will not reach base, meaning the pitcher was successful. His true talent as a hitter is probably about 15% to 20% better than the league average. That’s not Barry Bonds. Pablo Sandoval isn’t annoying because he’s unstoppable; he’s annoying because he’s kind of strategy-proof. He doesn’t have a clear weakness.

The best advice I can give is to just pitch him without pitching him stupid, and then whatever happens happens. He’s going to hit pitches he has no business hitting. It’s obnoxious. But there’s nothing you can do about that, so you just have to not let it bother you. You’re pitching to Pablo Sandoval in the World Series? Pitch however you usually pitch. Maybe see if you can pitch left-handed, if you don’t already do that. That’s the one thing, so maybe that’s the key. Pitch to Pablo Sandoval left-handed. If you can’t use that advice, there is no other advice.

World Series Preview: By the Numbers.

The World Series starts tonight, and if you’ve spent any time reading the internet over the last 24 hours, you’ve probably been inundated with preview articles. If you haven’t been, I’m particularly fond of this one from Jonah Keri and Ben Lindbergh at Grantland, mostly because it includes this fantastic image.

700


The rest of the preview is great too, which isn’t surprising, because Jonah and Ben do fantastic work on a regular basis. That preview is also annoying, as they stole a number of ideas I was going to spotlight in this post, which is why I stole their awesome outfield defense graph and put it in this one. But rather than cry over they-beat-me-to-it milk, we’ll just pivot and tackle the two World Series teams position by position. Forecasts are based on the 2015 Steamer projections found here on the site, and are based on an entire season’s worth of production.

Catcher

Giants: 6.7 WAR (#1 in MLB)
Royals: 4.5 WAR (#4 in MLB)

Salvador Perez is quite good, but he’s not Buster Posey. It’s also worth noting that catcher framing is not included in these projections, and the metrics suggest that Posey was much better at expanding the zone for his pitchers, making the difference likely even larger than this suggests. The Royals don’t have a deficiency behind the plate, but Posey is an advantage for the Giants against almost any other team they play.

Edge: San Francisco

First Base

Giants: 3.8
Royals: 2.7

Brandon Belt and Eric Hosmer are probably not quite as different going forward as they have been in the past, given Hosmer’s advantage in youth, but Belt is the better player right now. One additional slight advantage for the Giants: Belt has shown a minimal platoon split throughout his career, so he won’t be as easy to counter in high leverage situations as Hosmer, who hasn’t figured out how to hit good left-handed pitching yet.

Edge: San Francisco

Second Base

Giants: 2.0
Royals: 2.3

High-contact, low-power, moderate speed, and solid defense describes both Joe Panik and Omar Infante, two players cut from the same cloth. Neither is flashy, but both are serviceable regulars who can do enough to justify their spot in the line-up. These are the kinds of useful role players that good teams need to avoid having pits of despair, though Infante fell a little too close to that mark this year. His track record is fairly strong, though, and this isn’t the big advantage for San Francisco that their 2014 numbers would suggest.

Edge: Push

Shortstop

Giants: 2.2
Royals: 2.2

Brandon Crawford and Alcides Escobar are both in the big leagues for their gloves, and they both make plays that convince everyone watching that they’re among the elite defenders at their positions. The numbers don’t love either one as much, with both rating as just above average defenders, but both also hit well enough to be useful even without a lot of love from UZR. You could make a case that the numbers might be underrating both players, but it’s hard to make a case that it’s missing on one and not the other, so even if you adjust both up, the end result is still going to be the same.

Edge: Push

Third Base

Giants: 3.8
Royals: 3.4

This one’s a tougher sell, as Pablo Sandoval career on-base percentage is only 30 points lower than Mike Moustakas‘ career slugging percentage, and Sandoval isn’t exactly known as an on-base machine. As I noted before the ALCS, however, Steamer kind of loves Mike Moustakas, seeing improvements in his core peripherals this year that weren’t reflected in his overall line due to an absurdly low BABIP. By reputation and past performance, this is a big advantage for the Giants, but Steamer thinks this one is a lot closer than many think.

Edge: Push

Left Field

Giants: 0.9
Royals: 4.4

Here’s the biggest mismatch of the whole series, and the gap is actually even larger than the numbers suggest, since Steamer doesn’t know that Travis Ishikawa is a first baseman learning left field on the fly. Give him a strong defensive penalty than the forecast does, and the Giants are basically running replacement level players in left field, while the Royals might have the best left fielder in baseball. This one isn’t close.

Edge: Royals

Center Field

Giants: 2.2
Royals: 3.5

Gregor Blanco is one of the more underrated useful role players in baseball, but he’s not Lorenzo Cain or even Jarrod Dyson, and the Royals pair of speedsters give them an effective All-Star up the middle. Cain put on a show defensively in the ALCS, but it really says something about Dyson’s glove that Cain is the one who moves to right field when they put their defensive unit on the field to protect a lead late in the game. They have enough offense to justify their playing time, and their athleticism is unparalleled.

Edge: Royals

Right Field

Giants: 3.1
Royals: 2.4

Pence was a monster for the Giants this year, in part because he added over a full win in value with his defense and baserunning, but Steamer regresses both of those fairly heavily, pulling Pence down to the level of a good player rather than a star. I’d be okay bumping him up a bit here, as I think Pence is probably better than average at running the bases and playing defense, but the Aoki/Cain combination isn’t useless, so this isn’t a blowout the way the other corner spot is.

Edge: Giants

Designated Hitter

Giants: 1.8
Royals: 1.7

The injury to Michael Morse means that he gets to play the position he should have moved to years ago, as the Giants are one of the few NL teams who carried a natural DH all season. Often, the AL has an advantage over the NL when the DH is in use, but that won’t be the case in the four games in Kansas City. Steamer thinks Butler is better than his regular season struggles, but Morse gives the Giants a legitimate power threat, and evens out the bat-only spot.

Edge: Push

Starting Pitchers

Giants: 8.7
Royals: 10.4

Neither team is here because of their starting rotation, especially the guys after the #1 starter. James Shields and Madison Bumgarner are both high quality arms, but after them, it’s mostly just hang on and hope that the game is still close in the sixth inning. The projections like Yordano Ventura more than any other Giants starter, but sees most of the rest of the veterans as back-end innings eaters. Perhaps one of Jake Peavy, Tim Hudson, Ryan Vogelsong, Jeremy Guthrie, or Jason Vargas will make a significant difference with some outstanding innings, but it’s tough to make a case that either team will have a big edge due to the expected performance of any of those starters. Ventura is enough to tip the scales towards the Royals, but both of these groups are just around to try and not lose the series rather than win it.

Edge: Royals

Relief Pitchers

Giants: 0.7
Royals: 5.0

Much has been written about the remarkable trio at the end of the Royals bullpen, and Steamer sees this as the best bullpen in baseball, with no one else even challenging for the top spot. Greg Holland, Wade Davis, and Kelvin Herrera are significant weapons for the Royals, and the more often Ned Yost uses them, the higher the chances that Kansas City wins the whole thing.

But this projection almost certainly underestimates the Giants relief corps, since our WAR is based mostly on FIP, and the Giants have assembled a bullpen of guys who have built careers off of beating their FIPs. Santiago Casilla has a career 3.20 ERA and 3.92 FIP, a big enough gap that over 439 innings that he should get some credit for it. Sergio Romo, Javier Lopez, Jean Machi, and Jeremy Affeldt have smaller gaps, but each also has a lower lower ERA than FIP, which is one of the reasons why the Giants racked up +4.6 RA9-WAR from their relievers this year, versus just 0.5 FIP-WAR. This is one of the areas where our pitching WAR is most flawed, and the gap isn’t as big as the numbers above suggest.

But the Royals bullpen is better. Blowing everyone away is better than trying to limit hits or strand runners, even if you’re pretty adept at those secondary skills. The Giants bullpen is better than these numbers suggest, but it’s still not Herrera-Davis-Holland.

Edge: Royals

Overall

Mostly, we see a lot of similarities, or at least offsetting advantages. The Giants are a little better on the infield, but the Royals are a little better in the outfield. The Royals pitching is better, but probably not quite to the extent that the forecasts suggest. The Royals have home field advantage, but only if the series goes to the seventh game; because of the 2-3-2 schedule, the Giants actually play more home games if the series only goes five.

Our playoff odds have the Royals as favorites using the Steamer forecasts, but basically call it a coin-toss if you use 2014 statistics as your inputs instead. Neither team is clearly better than the other, though, and both teams have something close to a 50/50 chance of winning the series.

If forced to pick for the fun of getting mocked when the prediction inevitably goes wrong, I’d probably take the Royals to win in six or seven games, but that’s entirely dependent on Ned Yost leaning very heavily on his relievers and not asking too much of his rotation. If we regularly see Kelvin Herrera, Wade Davis, and Greg Holland combining for 12 outs per game, then I think the Royals are slightly more likely to come out on top. But it’s seven games of baseball, so in reality, we have no idea what’s going to happen. And that’s what makes it fun.

Kauffman Stadium: Pitcher-Friendly, Hitter-Friendly.

This October, there’s been a lot of talk about the Royals’ offense, which is a very unexpected sentence. By now everyone should be pretty familiar with the Royals’ approach: they try to hit the ball and make things happen, as opposed to sitting back and waiting for dingers. At a few points, you might’ve read remarks along these lines from Royals officials: if the team played in a different ballpark, they’d hit a lot more homers. This year the Royals were actually last in the American League in road home runs, so it’s not like dimensions have conspired to suffocate a juggernaut, but the bigger message is that the Royals have a big stadium. And Kauffman Stadium, indeed, is statistically tough on the longball.

Let’s play an assumption game for some reason. Say you’re given only one piece of information about a stadium, and from there you have to guess how the stadium plays overall. By our numbers, Kauffman Stadium has baseball’s seventh-lowest home-run factor. That means it’s probably pitcher-friendly, right? AT&T Park is pitcher-friendly. PNC Park is pitcher-friendly. Safeco, historically, has been pitcher-friendly. But this is the interesting twist, at least as far as park factors go: Kansas City’s ballpark is overall hitter-friendly. It’s just not so in the ordinary way.

You can look at this in a few places. By the FanGraphs numbers, Kauffman’s home-run factor is 94, where 100 is average. That puts it between Target Field and Angel Stadium. Yet the overall run factor is 101, equal with Great American Ball Park and just a point behind Camden Yards. Meanwhile, StatCorner offers its own park factors, broken down by handedness, and that site also sees the dinger reduction, and the overall offensive boost. Splitting parks by handedness, we can look at 60 different factors. Both of Kauffman’s home-run factors rank in the bottom 25%, but both of the run factors rank in the upper 35%. Clearly, there’s something a little unusual happening here, since there’s nothing more impactful from the offensive side than a homer.

So how does Kauffman manage to be both pitcher-friendly and hitter-friendly? The answer’s actually pretty intuitive, and it has to do with the same stuff we talked about when a few teams were bringing the fences in in the recent past. When you move in the fences, you make homers more likely, but you also shrink the outfield. When the fences are far away, the outfield’s bigger, and here’s a relevant recent excerpt from the USA Today:

But the bigger gaps – the Kauffman outfield has the most square footage in the majors – favored the Orioles early.

I don’t buy that, exactly — I’m pretty sure Coors Field is bigger. But Kauffman’s still big, seemingly the biggest yard in at least its own league. More space means fewer homers, but it also means a lower percentage of space that can be covered by defenders. Which means more baseballs reaching more grass, which means more hits, which — I don’t have to explain this to you.

Have you ever messed around on Clem’s Baseball? I’d recommend it, if you’re into this stuff, and that site backs up the idea that Kauffman Stadium has the most square footage in the outfield in the American League. The dimensions down the lines are basically average, but to left-center, Kauffman’s more than a full standard deviation deeper than average. It’s even deeper, relatively speaking, to right-center, and center’s still 410 feet away, against an average of 404. Kauffman’s a spacious place. The Royals have known this for years. It’s probably not a coincidence the team has been built as it has.

The dimensions leave a statistical signature. Over the last five years, there have been 773 home runs in Royals home games, and 910 home runs in Royals road games. However:

Runs scored

Royals home games: 4,325
Royals road games: 4,162

Batting average on balls in play

Royals home games: .307
Royals road games: .298

wOBA

Royals home games: .323
Royals road games: .318

The FanGraphs numbers show Kauffman with an above-average singles factor, an above-average doubles factor, and a well above-average triples factor. As a different way of thinking about this, we can pull a little data from Baseball Savant. This year, in Royals home games, 21% of balls in play hit at least 300 feet went for homers. On the road, that rate was 26%. However, in Royals home games, 40% of balls in play hit at least 300 feet went for singles, doubles, or triples. On the road, that rate was 32%. That’s just one year of information, but it conveys the right idea. Home runs and hits can be negatively correlated.

There’s also a little bit more. You might notice that Kauffman has a below-average pop-up factor. It’s about as far removed from average as Oakland’s pop-up factor. Kauffman Stadium has a below-average amount of foul territory, in terms of square feet, and its backstop is closer to the plate than it is in most stadiums. So, over the last five years, Royals home games have featured a pop-up rate of 9.1% on fly balls, and Royals road games have come in at 10.9%. This is a small thing, but pop-ups are automatic outs, and pop-ups that drift into the seats are just strikes.

And finally, you’ll notice that Kauffman Stadium appears to reduce strikeouts, without reducing walks. It’s not quite Coors Field in that regard, but Coors is a freak, and the Kauffman note is interesting. Again, over the last five years, the home-game walk rate and the road-game walk rate have been even, around 8%. But Royals home games have had a strikeout rate under 17%, and Royals road games have had a strikeout rate over 18%. Strikeouts are also automatic outs, so Kauffman has for whatever reason encouraged more balls in play, and those balls in play have also been more likely to find the ground than they have been in other places. In one way, one very significant way, Kauffman has played difficult for hitters. In a variety of other ways, it’s more than balanced that out.

Kauffman isn’t alone like this. Target Field seems overall fine for offense, but bad for homers. The same goes for Marlins Park. Both seem like pretty good environmental comparisons, with Marlins Park in particular offering more square footage to compensate for the deep fences. When you think about it in depth, it makes all the sense in the world. But when you just consider it briefly, it’s odd. Not a lot of homers hit in Kansas City. Still plenty of runs, though, at least relative to the games played elsewhere. In large part because of all this, Dayton Moore assembled a rangey group of outfielders. In large part because of all this, the Royals’ defense looks worse by raw BABIP than it would if you adjusted it. Ballparks are complicated things, in the ways that they play, and Kauffman Stadium is one environment where pitchers might feel comfortable, while hitters feel comfortable too. Damage still gets done. It’s just relatively gentle.

The World Series of Power Versus Finesse.

Only three teams threw the ball faster, on average, than the Royals this year. Not surprising when you’ve got youth like Yordano Ventura, Greg Holland and Kelvin Herrera throwing fire on the regular.

Only one team threw the ball slower, on average, than the Giants this year. Not surprising when you have distinguished gentlemen like Tim Hudson, Ryan Vogelsong, and Jake Peavy stepping on the rubber three out of every five games.

This difference in velocities has ramifications for pitch mix, of course. The Royals threw fastballs more often than the Giants. The Giants threw breaking pitches more often than the Royals. In fact, the Giants threw more breaking pitches than anyone in baseball.

Is one team better equipped to handle the strength of the opposing team?

We have pitch type values on our leaderboards, and they provide a great way to look at this question. Though you can run into some strange places when you use the values to judge pitchers, some of those limitations go out the window when you use them to judge hitters.

For example, R.A. Dickey has sometimes shown a plus fastball by pitch type values. Over his Mets career, it was regularly a top pitch, and in 2011, you could have used the number to say he had a top-15 fastball. That year, he got 2.9% whiffs on his fastball, so it probably wasn’t a top-15 pitch.

He did get an above-average 45.6% ground balls on his fastball that year, and that points to another flaw with the pitch type values. They measure what happens on that particular pitch and can be subject to the luck of the bouncing ball. He had a .278 batting average on balls in play on the fastball in 2011, a year after that number was .405 on the same pitch.

If you use these to judge a hitter, you do rid yourself of the first problem. Unless every pitcher is sequencing the slider in the same way to the hitter, you can probably get a good sense of a hitter’s ability to hit a particular pitch from his pitch type values. And if you take a bigger sample than one year, you might be able to mitigate the second flaw by gathering a large amount of balls in play.

So let’s not point too heavily at this leaderboard that suggests that the Royals can’t hit curveballs, are below average against sliders, and that the Giants can handle fastballs. That might seem like a large sample until you realize it’s just a collection of small samples, made murkier by how the balls bounced for each player in particular.

Let’s instead look at the respective lineups and see how they’ve fared against fastballs and breakers over the last three years. Now we’re increasing the balls in play sample and reducing the effect of sequencing. By using the ‘per 100′ values (/c), we’ll also reduce the effect of pitch and plate appearance volume on the outcome.

Royals wFB/c wSL/c wCB/c
Alcides Escobar 0.04 -1.88 0.38
Nori Aoki 0.45 1.61 1.89
Lorenzo Cain 0.40 -0.18 -0.83
Eric Hosmer 0.51 -1.14 0.00
Billy Butler 1.27 -0.96 -0.58
Alex Gordon 1.05 0.19 -0.70
Salvador Perez 0.25 0.01 -0.87
Omar Infante -1.04 0.50 -0.61
Mike Moustakas -0.53 -0.76 0.35
Average 0.27 -0.29 -0.11
As a team, the Royals like fastballs. That’s too bad, considering the Giants’ reluctance to throw fastballs. As a team, the Royals hitters have not faired well against breaking pitches over the last three years. Once again, not a great fit considering their opponent. Maybe we’ll see some hits from Nori Aoki, and Alex Gordon (sixth-spot hitter) could pair some ability with the slider with more power.

But that’s two guys. The rest of the team is average or worse against breaking pitches. And, with a minimum of 1000 plate appearances, you’ll see that Cain, Perez, and Gordon are bottom-30 against the curveball. Escobar and Hosmer are bottom 20 against the slider over the past three years. They might have a tough time with guys like Madison Bumgarner (35% sliders), Tim Hudson (23% sliders), Ryan Vogelsong (19% curves), and Sergio Romo (52% sliders).

The Giants’ hitters have done better in general, but *how* they’ve done so is also important.

Giants wFB/c wSL/c wCB/c
Gregor Blanco -0.05 1.31 -0.25
Joe Panik 0.36 0.58 1.75
Buster Posey 1.47 0.37 -0.03
Pablo Sandoval 0.56 -0.57 0.98
Hunter Pence 0.38 1.15 0.81
Brandon Belt 1.12 0.11 -0.21
Travis Ishikawa -0.16 -1.13 1.17
Brandon Crawford 0.46 -1.71 -0.27
Michael Morse 1.04 -0.79 0.04
Average 0.58 -0.08 0.44
There are some hitters here that are vulnerable to breaking pitches. Crawford has problems with sliders, apparently, as do Sandoval and Ishikawa. The Giants are great against curveballs as a group, and that’s semi-relevant given the fact that only six teams threw more curves than the Royals. Panik, Sandoval, and Pence are ready for the yakkers.

But what the Royals do differently than anyone else is throw fastballs. And it does look like the Giants are well-suited to take that strength on. Posey was 19th-best against the fastball this year, even, and Crawford also found himself in the top 40 in the cumulative version of this statistic. There are some great fastball hitters on this list, and then there are some good ones.

By the pitch type values, at least, it looks like the Giants’ hitters are equipped to handle the fastballs of the Royals’ staff. And the Royals’ hitters may have trouble with the Giants’ breaking balls. These are general statements, hopefully made more believable by focusing on a larger sample. How Posey will do with 98 mph cheese from Ventura in particular is why we watch.
 
just curious...why do they call james shields big game? i know he pitches in them, but he hasnt even shined in any if i recall. or was that nickname he came into the league with

this is the series where ned yost catches up to them, right? bochgod
 
Last edited:
Because every athlete named James gets the "Big Game" moniker. That's all there is to it.
 
He literally got the nickname in the minors because he was a fan of James Worthy. I **** you not. Not because he's done anything special :lol: unless you count one start of 5+ with no runs as special.
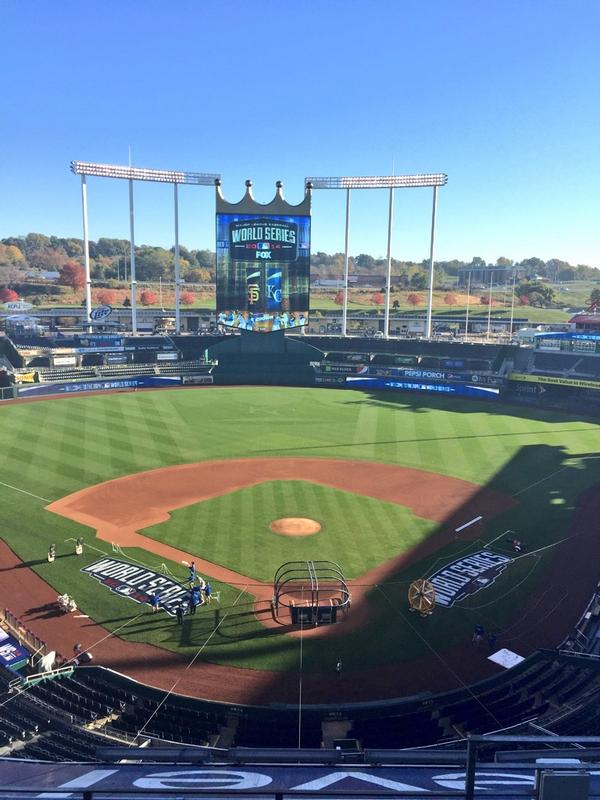
 
Hoping for a good series, seeing as these playoffs haven't had any.


I got the Giants in 6 close games.


WS MVP = Posey
 
Damb, someone really stumbled across some empty fields and was like "Yep, right here. Perfect place for a baseball stadium." :lol:

Whhhhat a beautiful day for a game, tho. :smokin

And a football stadium. Arrowhead is right next to it. I drove past them before and it was a beautiful sight. I'd really like to go back to both and see a game.
 
just curious...why do they call james shields big game? i know he pitches in them, but he hasnt even shined in any if i recall. or was that nickname he came into the league with

this is the series where ned yost catches up to them, right? bochgod
As someone said above me, he was a fan of James Worthy, thus getting the nickname. He has pitched in some pretty big games during the regular season (I know, nothing like postseason)...just hasn't performed well in the playoffs yet.

Good luck to the Giants and all the SF fans. I'm hoping for a fun series and KC victory. I'll say Royals in 5 (a bit homer, a bit thinking the Royals are just on an unstoppable roll right now)...
 
Quick question having a talk wit the homies in group text.

Does experience Come into play in trying to win a WS or anything for that matter like SB ect
 
Last edited:
Ya I'm having an argument wit my friend he just can't accept the fact that it plays a slight role maybe not the deciding factor but deff a slight role
 
it does play a role. take a look at the nationals vs giants.
Experience isn't why the Nationals lost. Their most experienced postseason hitters **** the bed, and their manager mismanaged the bullpen in crucial spots like he had been doing all season long.
 
Status
Not open for further replies.
Back
Top Bottom