The NBA Stats Thread: The 15-year chain reaction that led to the NBA's current offensive explosion

Blazers with 11 points from their bench, 7 by Maynor. Historically putrid bench. :smh:

BTW, RIP Brandon. *pours some out*
 
Last edited:
Sloan Sports Analytics Conference 2013: My Thoughts and Opinions

I attended the Sloan conference last week, and I left with a lot of opinions.

My opinions come from an outsider’s perspective, but an outsider who has done analytics in disciplines other than sports, and who works every day on a team of analytics nerds at your typical Silicon Valley tech company. Also note that I’ve attended the prior two Sloan conferences, so I knew what to expect to hear at the various panels. Also, I’m a terrible networker. That’s important to know, because…

1. You don’t go to Sloan to learn how to do analytics

You go to Sloan to network. Despite its reputation as a geek convention, many of its 2,700 attendees are not actually analytics/Bill James-y types of people. Many are MBA candidates (Sloan is MIT’s business school, after all), many are high school/college students who want to be close to sports people, some are vendors hawking their products, and many are marketing/sales/business operations people who work for teams, who want to work for teams, or work in the sports industry. You have a lot of consumers of analytics, but not necessarily many producers of analytics.

I would guess that these people comprise the majority of the attendees. After them, you have the people that do some form of sports analysis: academic researchers, bloggers, ESPN employees, and the team’s sports analytics employees themselves. If I were to guess, the count of sports analysts definitely wouldn’t be greater than 700, and is probably no more than 150-200.

The Sloan conference isn’t as geeky as its reputation implies, and it’s questionable whether the Sloan sports conference is a good place to find up-and-coming analytics talent. I had spoken to a few people who volunteered that the level of skills found at this conference weren’t as high as they expected. My boss wanted me to keep my eyes out for good analysts, and probably the best unemployed analyst I heard was Stan van Gundy during the Basketball Analytics panel.

There’s probably good analysis being done by teams. But you’re not going to learn that at Sloan, because teams keep it secret. Why should they share, right?

Funny enough, the best analytics at the Sloan conference actually happens on the business panels. An Orlando Magic executive presented good stuff around sales analytics, in particular the likelihood of selling season tickets as a function of time of day, as well as time during season. I even heard the words “decision tree” and “linear model” thrown around.

In fact, the only piece of analysis I remember from last year’s conference came from NBA marketing, who shared the effectiveness of making the Boston Celtics’ center court ad display shorter, and putting two small ad displays in the corners near the players bench. It turns out that television cameras spend more time at each end of the court, and having ad consoles at each end of the court increased exposure time for the advertiser, leading to bigger ad dollars. It also had the positive side effect of substituting lower-priced, less-desired corner seats for higher-priced, more-desired courtside seats.

You may not like ads or business-y things, but man that’s some interesting analysis.

In my opinion, if you want to learn how to do analytics or learn new methods, go to the business panels. They’ll actually share information. Also, go to the research paper presentations. Most of the other panels aren’t illuminating.

2. Data analysis isn’t the issue, it’s data management


When people think “analytics”, I get the impression that people think it means fancy algorithms and distribution curves and lots of Greek letters. In my opinion, a big chunk of data analysis is just smart counting, and optionally dividing by something so a number makes sense contextually.

I think the sports analytics community does this fairly well. But this smart counting assumes that the data collection piece has been taken care of. In basketball, the box score has typically been the place where analytics begins.

But in the new world of basketball analytics, the starting point will probably be SportVu’s XYZ coordinate data. The definition of the word “data” will change. Where “data” used to mean sanitized, summarized, and tractable, “data” will mean messy, overwhelming, error-prone, and frustrating. Living in a world of data streaming 25 times per second means you won’t be living in an Excel spreadsheet, but in something much, much bigger. Databases matter more. Parallel computing might have to be used. Data cleansing will really, really matter.

I believe too much of sports analytics focuses on stats, and not enough on data management. To me, stats are the by-product of good data management. Good data management makes for good analytics, and leads to confidence in your final results.

In fact, Vorped is simply an exercise in data warehousing, of which some components I’ve actually plugged into stuff at my day job. About 80% of my effort on Vorped is spent on making sure I have clean data, and even then, I know that parts of my data aren’t 100% accurate. Despite this, I have confidence in the data I present, because I know the underlying data has been processed pretty rigorously.

We need more people who are both willing and able to endure the drudgery of data management. It’s completely unsexy, but absolutely vital to making analytics work. And in the coming world of streaming sensor data similar to SportVu, having more data won’t make things easier, it’ll make things harder, because you have much more noise to sift through to find the signal, let alone finding the right signal.

At some point in the future, the XYZ coordinate data will likely lead to awesome findings, especially around screening, defense, and off-the-ball movement. However, I believe that there exist simpler methods and data sources that could answer useful basketball-related questions as good as, and in some cases better than, the current SportVu data. But if the NBA put cameras in all 30 arenas and disseminated all that data, my opinion would probably change.

3. Communication matters

I found it interesting that so many panels devoted time to discussing how to communicate analytics findings. Often communication proves to be the most challenging part of analysis, because human beings have emotions and egos that can prevent objectivity from carrying the discussion. I’ve experienced this countless times myself. If your listener fundamentally does not believe in data, or in you as an analyst, it usually doesn’t matter how good your models are, because in the end, that knowledge won’t be used.

The big exception is baseball. Moneyball worked so well because baseball’s rules create situations and data that make statistical analysis very natural. Assigning credit and blame for an at-bat is relatively straightforward. You have a batter and a pitcher and sometimes a fielder with an error. Also in baseball, at-bats are well-defined by the rules of the game, which make counting events pretty easy, which then allow stats to be relatively self-explanatory.

Basketball is so much harder. Assigning credit and blame gets very complicated when you consider non-box score things like screening, cuts to the basket, missed rotations, and bad spacing. A player can play an effective 30 minutes without registering a single shot attempt or assist.

I think this is why communicating analytics is much harder in non-baseball sports: collecting the right data to get the right model is hard, so we have to make-do with simpler data, which limits the depth of actionable knowledge we can gain from that analysis.

Current basketball statistics do a good job of identifying what teams and lineups are good (i.e. efficient). But they don’t necessarily tell us why they’re efficient. Is it because the lineup has better ball movement? Better screening? Better shot selection? Questions that start with “who” and “what” can be answered. Answering “why” is much, much harder.

I would guess that communication becomes challenging because basketball analytics has a hard time answering “why” questions. Decision-makers want actionable insights. In these cases, stats (or metrics) aren’t good enough alone. You need interpretation, too, which requires contextual knowledge outside of the data. And in my opinion, this is where the next opportunity lies for sports analysts in the near future, to deftly combine quantitative data with qualitative contextual information to tell a believable and accurate story.

In my experience, I’ve always tried to communicate to decision-makers that data will tell us some things, but won’t explain things fully. Like Nate Silver says, data analysis tends to be probabilistic. If you can use data to make a CEO or coach 70% confident instead of 50% confident in using a particular strategy, that’s a win. Learnings from data are typically incremental, and I think the goal should be to accumulate as many incremental learnings as possible, instead of searching for the silver bullet analysis that explains everything.

The prevalence of this topic makes me believe that the statistical movement hasn’t truly taken hold. To me, the statistical revolution will have happened when teams operate as data-driven organizations, not just organizations that happen to use data. Being data-driven means questioning assumptions, measuring the right things, and continually testing those assumptions with the data you’ve collected. Based on the chatter at the conference, I would guess that not many basketball teams meet these criteria.

Too long; didn’t read (TL;DR)

The Sloan conference isn’t as nerdy as its media coverage implies. Sports analytics is still in its nascent stages, more evolution than revolution, and still behind business analytics that have been doing this for decades.

While there are plenty good stats and quality data analyzers out there, we need more people involved in the ugly but important work of data collection. We also need open data, because that’s how we’re going to discover the next generation of sports analysts.

Finally, we need to be comfortable communicating both what data analysis does and doesn’t tell us, because we’re comfortable knowing that data analysis can’t explain everything.

Overall, the conference was a good experience. I met many good people doing good things, and yet I didn’t get to meet as many people as I hoped (I’m terrible at networking). I just wish more actual analytics happened. It would be awesome if there were a hackathon during next year’s conference.
Link
 
It's smart to be fun

Whether or not you agree that the level of play in the NBA is at an all-time high, there's no question that the amount of data available to coaches and teams has never been greater.

The digitalization of scouting through services such as Synergy allows coaches and players to watch playlists of the most granular detail. If Gregg Popovich wants to tweak his team's defense on Steve Nash pick-and-rolls, he can instantly pull up a series of clips focused on instances in which Nash dribbles left after splitting the initial coverage. SportVu can help them find the optimum number of dribbles for Tony Parker over the course of a game.

All this information leaves many to wonder if the way teams play basketball will become, as Ethan Sherwood Strauss described the Houston Rockets' offense, like so much "savvy accounting." Crunch the numbers, program the players to avoid scenarios with low probability of success, repeat ad infinitum.

That's not exactly a new process; coaches have sought maximum efficiency since the day the league began. But we also want improvisation, grace and athleticism, and the worry seems to be that increased data and scouting will lead to increased control from coaches.

Instead we're seeing something a bit different. A few of the teams that have invested seriously in analytics are playing the most exciting and free basketball. Nuggets coach George Karl appeared on the Dan Patrick Show to talk about his team's thrilling, up-tempo style (via Grantland's Brett Koremenos).

Karl said that the smarter teams become, the more important it is to encourage the kind of athletic, aggressive open-court style that just so happens to be the most entertaining style of play.
Coaching has now gotten so technical and scientific and there's so much of it and there's so much video and and there are so many statistics, that basically the reality of coaching is when you play 5-on-5 basketball it's very difficult to beat the defense and the scouting reports and the preparation and the tendencies that we know teams have. So what we're trying to do is play before those things can be settled in to.

We want to play early. We want to play before the defense sets. We want to play when there's mismatches running up and down the court. And to do that it takes a little extra work on working on your spacing and working on your commitment to run and play fast. I mean very few players want to play fast because you don't get rewarded all the time. You have to run maybe 10 times to get 2 shots, maybe 15 times to get 2 shots.

It's like offensive rebounding. A lot of big guys don't like to offensive rebound because you got to go all the time to get a few reinforcements. Our big guys here have done a great job the last few years. They really do run the floor well which helps the beginning of the spacing and gets the freedom of the ball. And then the other sport aspect of it is I just watch football. They're playing quicker, they're getting faster. They don't want the defense to get set, they don't want the defense to rotate in and match up their strength against your strength.

We're kind of trying to play not against the strength of a good defensive team, and the weakest part of the defensive team is normally in transition. I watch a soccer team like Spain play and so much of what they do is they don't hold the ball. They ping the ball around and make quick decisions. And I'm sure they have great plays and great actions, but it's basically don't let the defense feel like they can zone in on you because you're making quick decisions.

Translation: The analytics tell us the best way to play is in transition, and with maximum ball movement. That is, to give the fans what they want.

That's why the Nuggets lead the league in attempts at the rim by a wide margin and score in transition more than any other team. It's also great news for NBA fans who prize creativity and athleticism.

For teams like Denver, more data equals more fun.
Link
 
What was Value Added and EWA again?

I know it's wins added, based off stats, but do they use anything that actually includes other players, or actual wins/losses etc?
 
You reading Kevin Pelton articles? :lol: Those are the stats I can't put my head around.
 
Naw, doin stuff in my own head. Was just wondering like how PER doesn't factor in enough defense, hence slightly flawed, wonder if the Value Added ones had similar loopholes.
 
CourtVision: The New Kobe

On February 5 in Brooklyn, the Lakers and Nets were tied at 80 with about 2:50 left in the fourth quarter. The Lakers had the ball with seven seconds on the shot clock. Kobe Bryant had isolated on Gerald Wallace, 30 feet from the rim, beyond the left wing. Bryant crossed the ball over to his left hand and quickly went through his legs back to his right. He stuttered and accelerated to his right toward the paint. The attack consisted of two short dribbles and a few quickened strides. He elevated just outside the restricted area. Kris Humphries, the Nets' 6-foot-9, 235-pound power forward who would turn 28 the next day, awaited. Bryant was not deterred. With Gerald Wallace right on his heels and Humphries helping, the graying Mamba leaped and dunked hard on both men to make the score 82-80. In this one play Kobe changed the mood on the floor and in the arena. The Nets would score only three more points; the Lakers went on to win 92-83.


Since February 1, the Lakers are 13-5 and bear little resemblance to the bumbling mess that went 5-11 in January. Although they still may not be championship contenders, they’ve been one of the better teams in the Western Conference of late, and as the Utah Jazz continue to traipse toward an early vacation, it’s looking more and more likely that the Lakers' season will extend into the playoffs. Like it or not, the Lakers are surging, and like it or not Kobe Bryant is very relevant once again.

This is an impressive run for Bryant. Over his past 10 games, he is averaging 32 points, seven assists, and six rebounds while shooting over 53 percent from the field. The Lakers are 8-2 during this stretch, and Kobe was just named Western Conference Player of the Week.

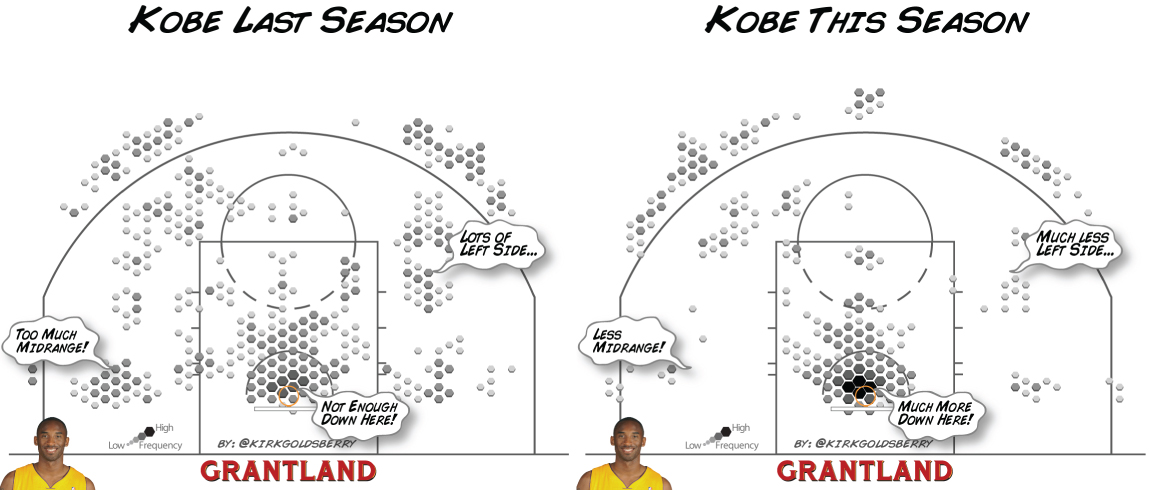
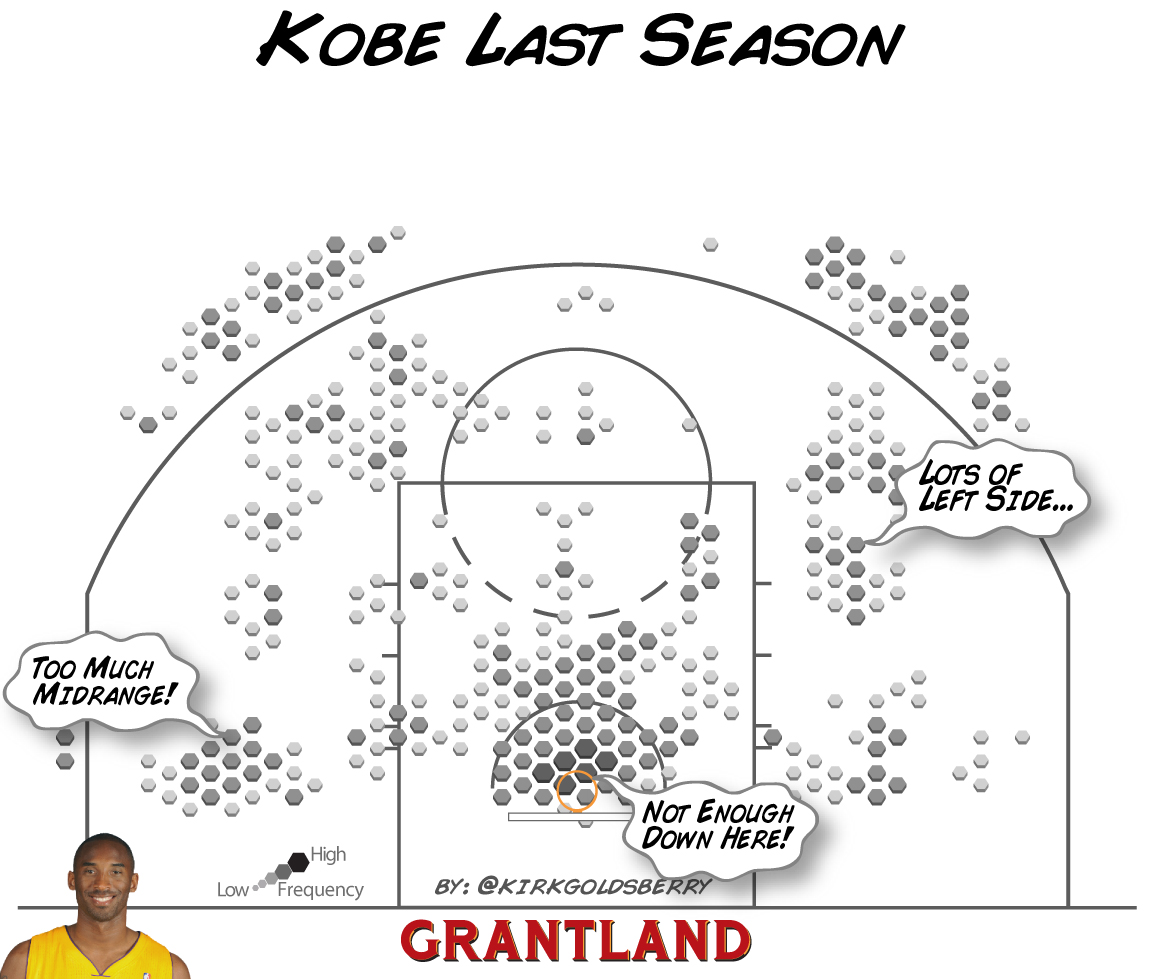
From an offensive perspective, Kobe is a better player than he was last season. Last year Kobe shot 43 percent from the field; this year he’s shooting 48 percent. This is a significant improvement, and as I frequently point out, these kinds of changes in field goal percentage usually have less to do with changes in shooting ability and more to do with changes in shot selection. This is certainly the case with Kobe — the biggest changes in his game since last season are a marked decrease in midrange shooting and a corresponding increase in close-range shooting. Last year, the lion’s share (55 percent) of Kobe’s shots came from the midrange, while only 24 percent came close to the basket.

grant_FreqLastYear_1152.jpg


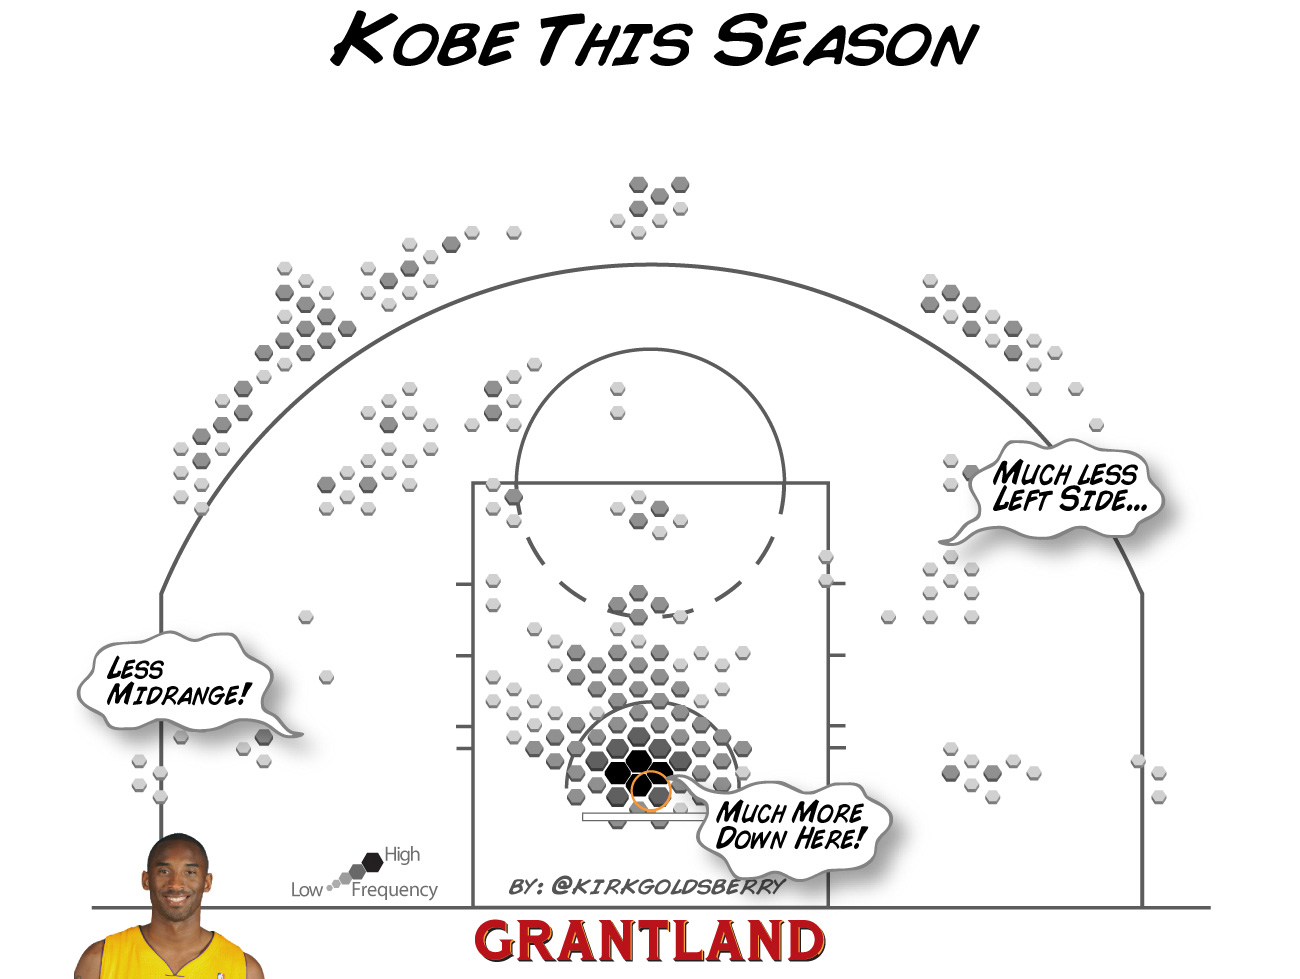
This season his midrange activity accounts for only 40.2 percent of his shooting, while his close-range attempts account for 34.2 percent; he’s settling for midrange jumpers less, while attacking the rim more.

grant_e_KobeFreqThisYear_1152.jpg


As you can see, many of Kobe’s midrange shot clusters have either diminished or disappeared altogether. Don’t get me wrong; Kobe still loves the midrange jumper, but this love affair is a bit less torrid than it was a year ago.

grant_FreqBoth_1152.jpg


For years Bryant’s shot chart wasn’t very interesting. There wasn’t much to glean from it other than Kobe shoots a lot from everywhere, and he shoots pretty much at league average. His skill was the ability to get a decent shot anytime he wanted. Bryant used to be the least finicky shooter in the league, but this is no longer the case. Contemporary Bryant’s charts feature clear clusters of activity and newfound asymmetry. Whereas in past seasons his shots have been equally distributed on both sides, Kobe is more of a right-side player this season. His favorite 3-point shot is clearly that right wing shot, and his favorite midrange shot is obviously near the right elbow.

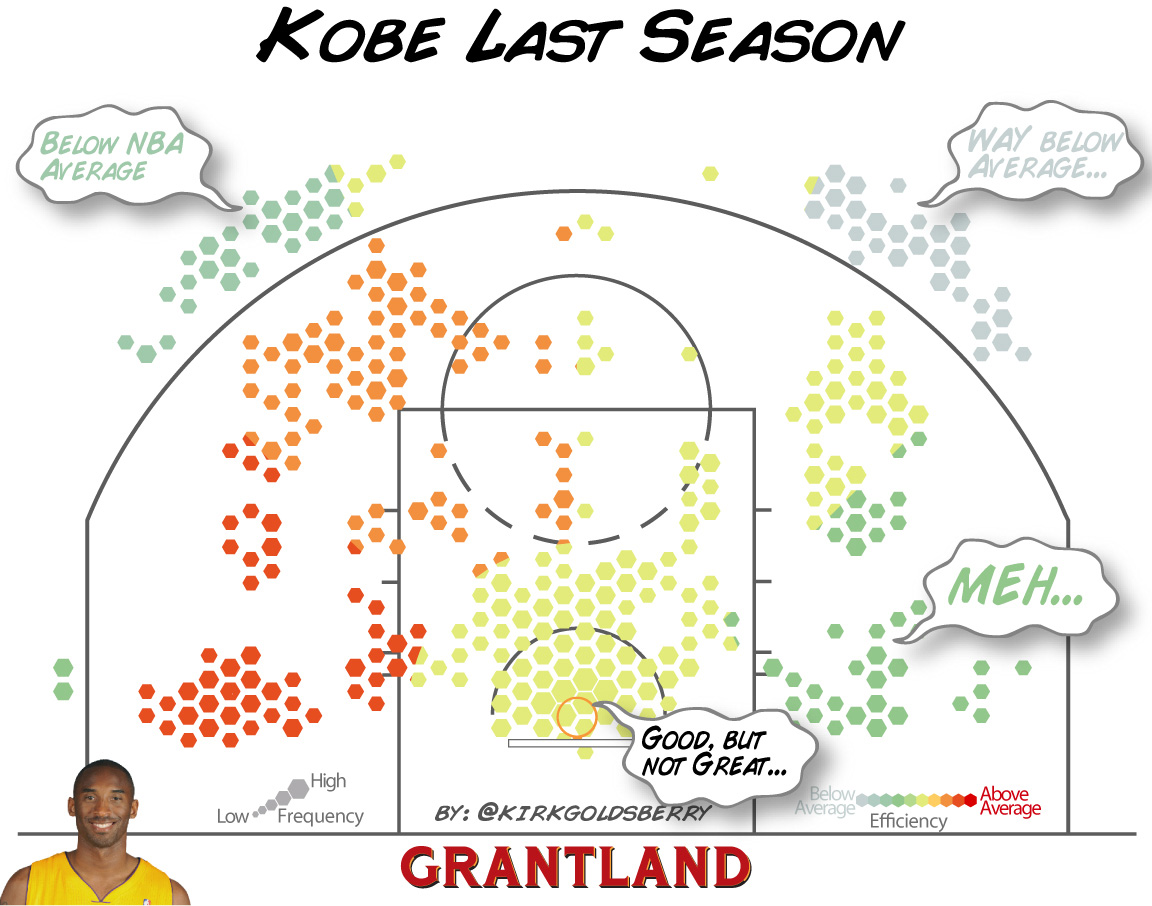
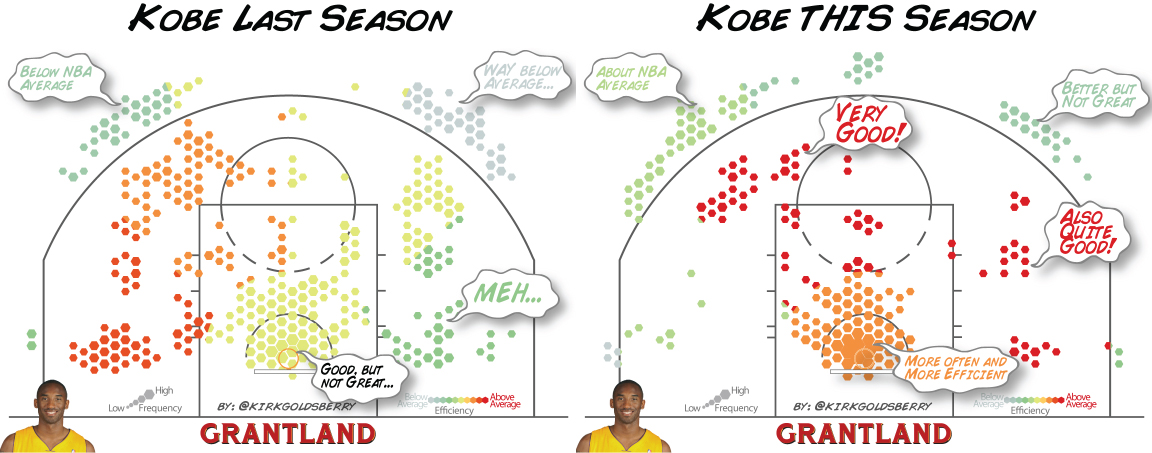
Kobe is also more efficient. It’s not as if he was bad last year, but he was an average or below-average shooter in many of his most active spots. He especially struggled from beyond the arc along both wings.

grant_e_KobeEff_LastYear_1152.jpg


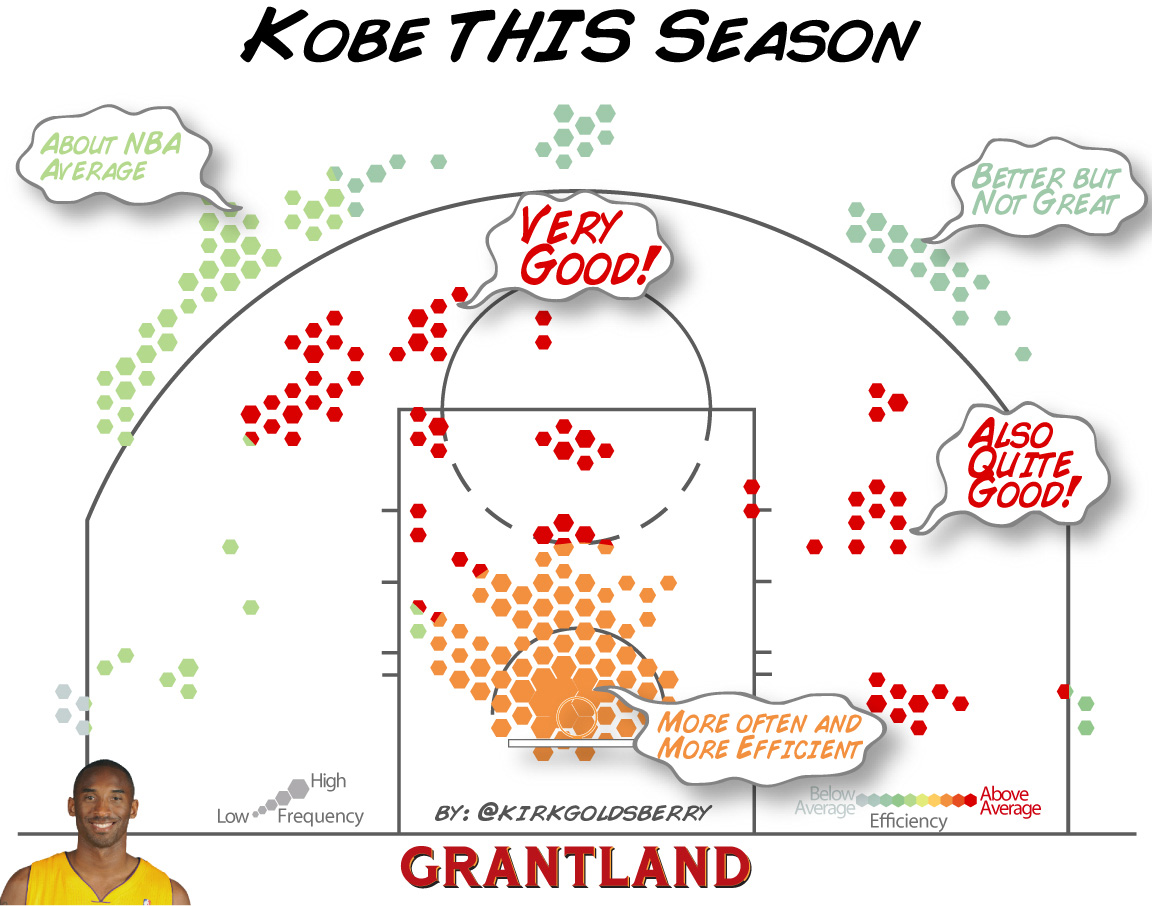
Last season Bryant shot a forgettable 55.3 percent near the basket, which is only marginally above the league’s average. This season that number has climbed to 60.1 percent. He's getting close-range shots more frequently, and he’s making them at higher rates. He’s also shooting better from 3-point range, where his efficiency has also increased by 4 percent.

grant_e_KobeEff_ThisYear_1152.jpg


Bryant’s improved his shooting almost everywhere on the court, but the most important changes are definitely near the basket and in the midrange, where sometimes the best shot is no shot at all.

grant_EffBoth_1152.jpg


The structure of Bryant’s game has changed. It’s more concentrated and it’s more aggressive. By reducing the midrange shots and increasing his at-rim activity, he has improved his overall scoring efficiency. Does this mean Graying Mamba has one more run in him? Maybe, maybe not, but the way he’s going, it looks like he might. Kobe is famous for his work ethic, but is less famous for his high basketball IQ and his ability to adapt and change his game according to the needs of his team and the lessening abilities of his aging body. The fact that he’s having this good of a season at age 34 is impressive, and the fact that he’s doing it amid this season’s Staples soap opera is astonishing. Whether this all translates into a deep playoff run remains to be seen, but I doubt many Western Conference foes will be excited to draw the Lakers in that first-round playoff series.

Link
 
I know it's early, but I really like what Orlando has started with post Dwight.

Vucevic, Harris, Harkless and Nicholson is a solid start. I just don't get why they paid Jameer an extra year, and I hope like hell Hedo doesn't torture them and opt in.

Affalo is nice if they decide to use him, but I bet they could flip him within a year or so and get out from his deal.

Hope to get another top 5 pick or so with their younger core, within 2 years they could be a solid little group.

I think they're gonna be in good shape pretty soon, just need to move Hedo/Jameer and Affalo within the next 12 months if possible. Maybe Baby Davis too.
 
Lawson and Ill Will have been balling out :smokin

Agree with Orlando, lot of good young role players there. Trade Afflalo this off-season bottom-out again and cross your fingers for Wiggins
 
View media item 313479
43 points on 18-48 (37.5%), two free throw attempts and 22 assists to 18 turnovers since he returned from injury. The Jazz are 1-4 in that time.

Efficiency ratings of guys that have played "point guard" for the Jazz this season:

Mo Williams - 13.8
Randy Foye - 11.4
Alec Burks - 10.9
Jamaal Tinsley - 10.4
Earl Watson - 7.5

10.8

To quantify them as one player, they would rank behind Sebastian Telfair, be on par with John Salmons, and just ahead of Michael Beasley.

Shots made-shots attempted:

Williams - 137-318 (43.1%)
Burks - 124-303 (40.9%
Foye - 234-603 (38.8%)
Tinsley - 77-215 (35.8%)
Watson - 35-112 (31.3%)

607-1551 (39%)

To quantify them as one player, they would rank dead last among qualified players, behind the likes of Rudy Gay, Beasley, J.R. Smith, etc.

Assists to turnovers:

Watson - 180:65 (2.77)
Tinsley - 256:94 (2.72)
Williams - 182:83 (2.19)
Foye - 134:79 (1.70)
Burks - 77:64 (1.20)

829:385 (2.15)

To quantify them as one player, they would rank just behind Russell Westbrook, and on par with Jeremy Lin.
 
Last edited:
Yikes.

But to be fair to Burks, he's playing out of position. He's a SG, with just enough skills to masquerade as a PG in spots.
 
Last edited:
Cleveland Cavaliers are using advanced statistics in new ways

Some day, you might be able to compare which NBA player runs the farthest each game, which one sprints the fastest, and who snags more rebounds that carom in his direction when he's on the right side of the low block than any other player.

What, exactly, do all those numbers really tell you? That part is still to be determined. But it's still pretty cool to know it all, isn't it?

Those kind of advanced statistics -- and more -- already are being recorded by 15 teams in the NBA, thanks to a sophisticated tracking system called SportVU. Six cameras installed in the catwalks high above courts capture data 25 times per second, and a complicated algorithm turns that into a kind of deep statistical analysis unseen in basketball before.

As teams still are grappling with how to best use the data, the Cavaliers have dived right into the sharing of those numbers with Cleveland fans. This season, the Cavaliers became the first team to use these statistics on the business side, flashing those numbers on the scoreboard at The Q during breaks in the game.

Fans have seen that Tristan Thompson runs about 2.23 miles each game. They might learn that Jason Kidd passes 90 percent of the time he touches the ball. Or that Kevin Durant averages 55 touches per game and .55 points per touch.

"The big thing for us is we've spent so much time with the basketball side that we're excited about exposing this to the fans," said Brian Kopp, vice president of strategy and development for STATS, LLC, which owns SportVU. "It doesn't have to be data geeks who are going to love this stuff."

The Cavaliers are still relatively new to the SportVU, having installed the system in December. But they began using the advanced statistics on the scoreboard in late January and hope to integrate the use of the intriguing numbers throughout the franchise operation.

First, they're learning what, exactly, all the numbers mean. SportVU tracks all 10 players and the ball on the court during play, and when paired with the game's play-by-play, it can calculate data for any spatial dimension. They can learn who rebounds best in traffic, what the arc of a player's shot is, who records the most "hockey" assists, who sprints more during a game, and on and on and on.

"Everyone knows not all rebounds are the same," Kopp said. "Now we can track who's best at rebounding in traffic. Who's the best at getting the ball when it's near them and who's the best getting around the ball in terms of being more active."

The application of all that data still is in its infancy. SportVU first began to be used in the NBA three seasons ago, and STATS, LLC, hopes to have about 20 teams subscribing by next season. Coaches might use it to motivate players with hard data (they can tell someone he stays within a three-foot radius for 75 percent of the game, for instance), or to help players improve, particularly when returning from injury.

"Imagine if you can go to Kyrie (Irving) and say, 'You're coming back from your injury and we've measured your shot is a couple inches flatter than it used to be,'" Kopp said. "There's a lot of coaching that can be done."

They see potential for the numbers to be used to not only help the basketball side use the numbers to coach and evaluate players better, but also for fans to have a more interactive, more in-depth experience with the game.

"I never played basketball, I never played professionally, but I saw that this was next level-next level stuff," said Kerry Bubolz, the Cavaliers' president of business operations. "I was fascinated by it, and knew we've got to figure out a way to push this out in the arena, on Q Tube, on mobile."

Eventually, the Cavaliers hope to use the information with corporate sponsors and in a more interactive way with fans. The possibilities still are untapped, they think.

"When we have a full season of data, then we can sit down and think what do we really want to accomplish with this, what types of opportunities are there from a basketball end, what else we can do on twitter or mobile or cavs.com, where are all the places this makes sense," Bubolz said. "We've had a lot of fun with it and we'll look to take it to the next level for next year."
Link
 
Lights, Cameras, Revolution

The NBA is undergoing an analytical transformation, and the Raptors are one of the teams at the forefront. For the first time, here is an exclusive, inside look at how SportVU is changing basketball.

New technology and statistics will change the way we understand basketball, even if they also create friction between coaches and front-office personnel trying to integrate new concepts into on-court play. The most important innovation in the NBA in recent years is a camera-tracking system, known as SportVU, that records every movement on the floor and spits it back at its front-office keepers as a byzantine series of geometric coordinates. Fifteen NBA teams have purchased the cameras, which cost about $100,000 per year, from STATS LLC; turning those X-Y coordinates into useful data is the main challenge those teams face (The 15 teams, once again: New York, Atlanta, Boston, Washington, Milwaukee, Toronto, Philadelphia, Cleveland, Dallas, Oklahoma City, Minnesota, Golden State, Houston, San Antonio, and Phoenix).

Some teams are just starting with the cameras, while others that bought them right away are far ahead and asking very interesting questions. Those 15 teams have been very secretive in revealing how they've used the data, but one team that has made serious progress — the Toronto Raptors — opened up the black box in a series of meetings this month with Grantland.

The future of the NBA, at least in one place, looks like this:


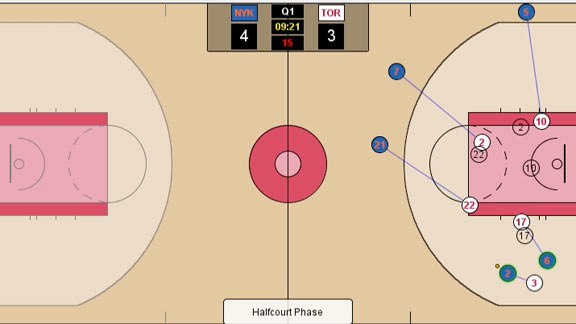
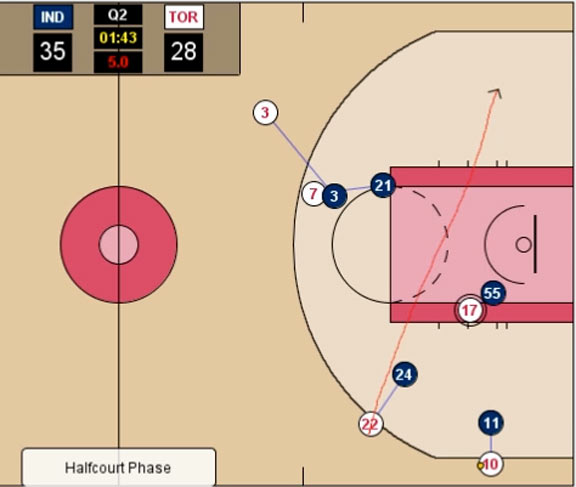
That's Jason Kidd hitting a 3-pointer off a Carmelo Anthony pick-and-roll in the first quarter of Toronto's February 22 home win over the Knicks; the Knicks are in blue, passing the little yellow ball around, and the Toronto players are colored white. It looks simple, but the process of getting there took a bunch of people, including three Toronto front-office employees, more than a half-decade of work. In simple terms: The Raptors' analytics team wrote insanely complex code that turned all those X-Y coordinates from every second of every recorded game into playable video files. The code can recognize everything — when a pick-and-roll occurred, where it occurred, whether the pick actually hit a defender, and the position of all 10 players on the floor as the play unfolded. The team also factored in the individual skill set of every NBA player, so the program understands that Chris Paul is much more dangerous from midrange than Rajon Rondo, and that Roy Hibbert is taller than Al Horford (There is much, much more, including a massive set of statistics on team tendencies I'll address in a future piece).

That last bit — the ability to recognize individual player skills — is crucial for the juiciest bit of what the Raptors have accomplished: those clear circles that sort of follow the Toronto players around and have the same jersey numbers. Those are ghost players, and they are doing what Toronto's coaching staff and analytics team believe the players should have done on this play — and on every other Toronto play the cameras have recorded. (This includes a whopping 140,000 logged plays, about half of which are pick-and-rolls). The system has factored in Toronto's actual scheme and the expected point value of every possession as play evolves(In simple terms: The expected value of a possession when Kyle Korver is taking an open corner 3 is much higher than when Josh Smith is taking a contested 20-footer). The team could use that expected value system to build an "ideal" NBA defense irrespective of the Toronto scheme, but doing so today would be pointless, since part of the team's job is to sell a sometimes skeptical coaching staff on the value of all these new numbers and computer programs, says Alex Rucker, the Raptors' director of analytics.

"You need that coaching perspective," Rucker says. "But we are still looking for where the rules are wrong — areas where there are systemic things that are wrong with what we do on the court. But any system needs to comply with what the coaches want, and what the players can do."

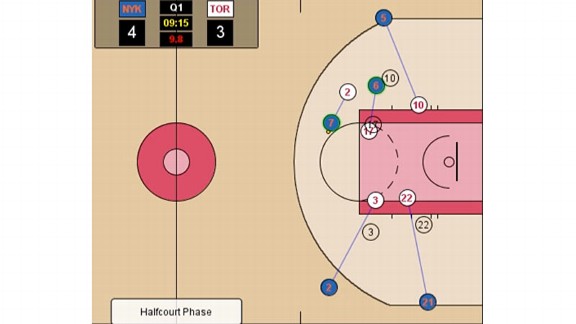
One early finding: The ghost players are consistently more aggressive on help defense than the real Toronto players. Check out DeMar DeRozan's ghost (no. 10) as Raymond Felton (no. 2) and Tyson Chandler (no. 6) run a pick-and-roll on the right wing during the first stage of this same New York possession:

gl_rapskts_576.jpg


Ghost DeRozan is in the middle of the paint to deter any pass to Chandler, while Ghost Landry Fields (no. 2) has zoned up between Anthony (no. 7) and Kidd (no. 5) on the weak side. Fields is actually closer to Kidd, in part because the program understands the higher expected value of a corner 3. That's why Ghost Rudy Gay (no. 22) has moved a bit toward Fields's man, even as the real versions of both players stick much more closely to their original assignments.

The Knicks eventually reset and swing the ball to Anthony for a pick-and-roll with Chandler. Look again at Ghost DeRozan vs. Real DeRozan as Chandler rolls to the hoop:

grant_e_raps-knicks2_576.jpg


Ghost DeRozan has left Kidd to slam into Chandler much earlier, and much higher on the floor, than Real DeRozan actually did. Since Anthony is dribbling toward the right side of the floor, the left side becomes the "weak" side, and it is the duty of the weakside defender in almost every NBA defense to help on the big man (Chandler) rolling to the paint. DeRozan does that here, but he does it too late; doing so earlier would stop Chandler sooner and allow both DeRozan and Jonas Valanciunas (no. 17) to retreat more easily to their original marks.

The ghosts in Toronto's ideal defense are almost always more aggressive helpers than real players, and that's true across the league, according to the analytics team and Toronto's coaching staff. Teams either haven't realized they should be sending even more help toward the middle and the strong side, and sending that help sooner, or they haven't fully convinced players to behave in this way.

"There's a clear deterrent value in having guys in the sight line of the guy with the ball," Rucker says. "They don't even have to do anything. If they're just in there, they'll make a difference."

Attaching numbers to things like the placement of a defensive player represents a major advancement in sports statistics.

"Anybody who is going to pooh-pooh this kind of analysis will say things like, 'You can't measure defense, because it's all about the guy who doesn't help or rotate,'" says Keith Boyarsky, the team's technical director of analytics. "That it's about what you can't measure. But that's exactly what we're measuring."

It can be tough, say coaches, to sell players on drifting so far from their own assignment. "Guys don't want to be embarrassed, or see themselves on TV giving up a dunk or an open 3," says Micah Nori, a longtime Raptors assistant who has worked closely with Rucker's team. "Even though basketball is essentially five guys guarding the ball, it's hard to get players away from the concept of, 'This is my guy.'"

Having players a foot or two out of position can be fatal to a defense, says Tom Sterner, a Raptors assistant and something of a tech guru (Sterner, who began his NBA career as a video coordinator for the Magic 23 years ago, has a master's degree in sports administration and computers, and was once chair of the NBA's technology committee). "The players are just so quick in the NBA," Sterner says. "One or two feet can make a huge difference."

Ultra-aggressive help defense is really hard work. Replay that clip and watch how far DeRozan's ghost has to move as the Knicks swing the ball. That's brutal, and it's not a coincidence that the only team that consistently mirrors the help defense of its ghosts is Miami, Rucker says. The Heat have three of the best wing defenders in the league in Shane Battier, LeBron James, and Dwyane Wade, and the latter two are among the NBA's most gifted pure athletes. James can mimic DeRozan's hyperactive ghost in a way no other player can, Rucker says. "LeBron basically messes up the system and the ghosts," Rucker says. "He does things that are just unsustainable for most players."

Nori offers another reason for widespread overcautious help defense: Players are worried about committing a defensive three-seconds violation. But Nori says they shouldn't be. "Have you seen a game where they've called more than three?" he asks. "Even if they call three, if I can get away with 15, I should be in the paint. Everything you hear from the league is about flow and pace and not slowing the game down with technical fouls."

Here's another example of what the Raptors' analytics team describes as underhelping — a George Hill–David West pick-and-roll on the left side of the floor from a Pacers-Raptors game this season:


Two things happen here, and both are representative of mistakes defenses make all the time, Rucker and his team say. First: Amir Johnson (no. 15) gets himself way out of position relative to his ghost (also No. 15) by chasing Hill toward the middle of the floor:

gl_dwest1_576.jpg


Johnson is very good at chasing ball handlers beyond the 3-point line, but he didn't have to go so far out here, since Hill dribbles away from the basket and is thus making himself a non-threat.

The program logs Johnson for a breakdown, and that breakdown leads to another mistake from Gay (no. 22):

grant_e_west2_576.jpg


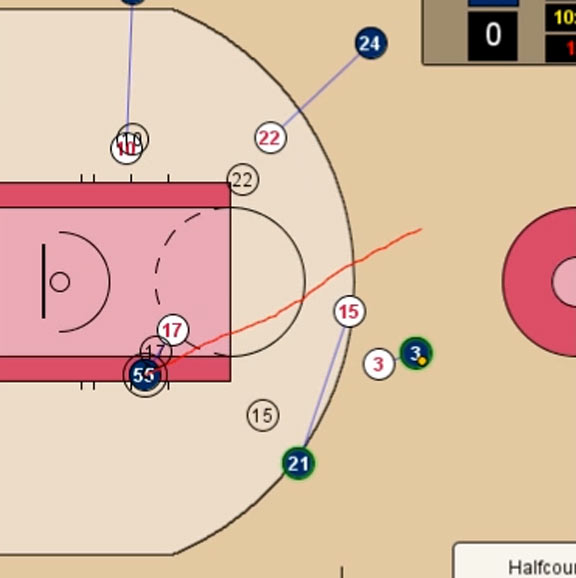
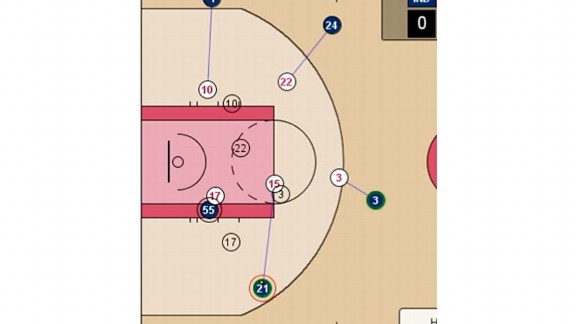
West (no. 21) now has the ball, and with Johnson so far away, the ghost team has recognized a crisis the real players failed to see. The ghost of Valanciunas (no. 17) has abandoned Roy Hibbert (no. 55, on the left block) to run out at West, and Ghost Valanciunas can do that with confidence, because he knows Ghost Gay will leave Paul George (no. 24) in order to crash down on Hibbert in the paint. But neither player moves, and West casually drains a midranger.

Just a reminder: The movement of the ghosts is based mostly on the expected value of a possession, calculated multiple times per second, as that possession moves along; Ghost Gay is the rotator in part because the program understands that leaving George open is less damaging than DeRozan (no. 10) leaving a shooter in the corner. The ghosts are not moving randomly, or even just in the way the team's coaches would like. They are moving in a way the Raptors believe specific defensive players should move to thwart specific plays executed by specific offensive players with wildly different skill sets.

It is a very impressive piece of work. "Most teams are using spreadsheets or just using our reports," says Brian Kopp, executive vice-president at STATS. "The Raptors go a step beyond that, which only a few teams are doing, and their visualizations are the best I've seen." Kopp hasn't seen everything teams are doing, since teams are secretive even in dealing with STATS.

That does not mean it has been an easy sell to the team's coaching staff, though Sterner and Nori are enthusiastic about analytics and have helped craft the ghost defense. Everyone likes the ghost system, but some of the larger analytics-related issues have caused friction between the front office and some of the coaches — even if everyone involved is mostly polite about it. "It's always going to be a challenge," says Ed Stefanski, Toronto's executive vice-president of basketball operations. "A lot of high-level coaches have come out against analytics, but it's the wave of the future, and you've got to jump on."

Bryan Colangelo, the Raptors' GM, had already set Toronto on the SportVU path before hiring Stefanski in the fall of 2011, and Stefanski credited Colangelo with pushing the Raptors in the right direction.

The coaches, even the most receptive ones, seem to view analytics and SportVU mostly as a tool to confirm what they already think and know. Some samples:

Dwane Casey, Toronto's head coach: "It's a good backup for what your eyes see." Casey added, "It may also shed light on something else," a sentiment both Nori and Sterner echoed at points. "But you can't make all your decisions based on it, and it can't measure heart, and chemistry, and personality."

Sterner: "It helps reinforce your gut. Most of the time, your gut is pretty much right."

Nori: "More than anything, it's a tool to help confirm what your eyes see."

The analytics team agrees that most of the new knowledge will be along the margins — that coaches leaguewide get most of the big, systematic things right — but that the analytics will nonetheless offer more in the way of new discoveries that might contradict what we think we know. "A lot of coaches will say how great it is that analytics confirm what they already see," Boyarsky says. "The fact of the matter is, that's not really true."

An example: The analytics team is unanimous, and rather emphatic, that every team should shoot more 3s — including the Raptors and even the Rockets, who are on pace to break the NBA record for most 3-point attempts in a season.

Take this possession from the same Raptors-Pacers game (I've removed the ghost players to make it easier to visualize):


The analytics team would have liked DeRozan (no. 10), a sub–30 percent 3-point shooter, to jack up a contested 3 at this moment — with about five seconds left on the shot clock:

gl_demarts1_576.jpg


DeRozan instead drives baseline and tries to squeeze a pass to Gay (no. 22) that Hill (no. 3) deflects out of bounds with less than a second left on the shot clock. For Rucker and his team, this is a question that gets at the value of particular shots, the impact of the shot clock, and how coaches teach players. "When you ask coaches what's better between a 28 percent 3-point shot and a 42 percent midrange shot, they'll say the 42 percent shot," Rucker says. "And that's objectively false. It's wrong. If LeBron James just jacked a 3 on every single possession, that'd be an exceptionally good offense. That's a conversation we've had with our coaching staff, and let's just say they don't support that approach."

The coaches aren't even close to being onboard with such a 3-happy philosophy yet. "To have guys who shoot 3s that can't break that 35 percent break-even point, you have to really evaluate that," Sterner says.

"You can shoot as many 3s as you'd like," Casey says, "but if you don't make them, that philosophy goes out the window. There's always going to be disagreements. Analytics might give you a number, but you can't live by that number." Nori points out Toronto is shooting more 3s this season, and credits that in part to the influence of analytics.

Casey is obviously right that DeRozan is a bad 3-point shooter. But the analytics team argues that even sub–35 percent 3-point shooters should jack more 3s, (Paul Millsap is an example of a player who Rucker, Boyarsky, and Eric Khoury, the team's analytics engineer, believe should have free rein to attempt 3s). and that coaches should probably spend more time turning below-average 3-point shooters into something close to average ones.

"Player development and coaching are scarce resources," Rucker says. "You only have so much practice time. At a very basic level, a guy going from 25 percent to 30 percent from 3-point range is far more meaningful than a guy improving from 35 percent to 40 percent from midrange."

The divide touches both on player development and on the degree to which the limitations of personnel should guide how a team plays. In very general terms, coaches tend to see personnel as paramount and limiting, while the analytics guys — from an upstairs office, of course — are more comfortable allowing players to stretch themselves toward more mathematically sound decisions. In other words: Paul Millsap is 30-of-109 career from 3-point range? Who cares! Let him shoot, and shift some of his practice time toward a shot that doesn't conventionally fit his skill set and build.

Valanciunas, of course, has been the chief focus of Toronto's player development staff this season, and that has been another source of tension between the analytics team and the coaching staff. Valanciunas, like most rookies, misses rotations, overhelps, and commits other sins of positioning on defense. Coaches hate that stuff, and they've often nailed Valanciunas to the bench in crunch time in favor of Aaron Gray — a fundamentally sound player who lacks NBA athleticism.

The numbers in large part disagree with that tactic, at least as it relates to Valanciunas's defense. The Raptors' defense has been better with Valanciunas on the floor (The offense has actually been worse, to a much larger degree, per NBA.com). More importantly, the visualization data shows that Valanciunas is active and athletic enough to make up for all his defensive mistakes, Rucker and his team say.

"With Jonas — yeah, he's making mistakes," Boyarsky says. "But who cares?"

Casey said he hasn't had deep discussions with the analytics team about Valanciunas, but Sterner has, and he agreed it's sometimes a thorny issue of valuing culture over results. "You want your defense to be sound," Sterner says. "Even though the production might be better, you still want [Valanciunas] doing the right thing.

But let's not exaggerate: This isn't Moneyball, with people at each other's throats and folks threatening to quit their jobs. It's not even close to that, actually, and that's in part because the SportVU data do something most smart NBA people have been doing for a long time: combine video (the "eye test") with advanced statistics. Understanding sports has never been about one or the other; it's about both, and the cameras represent the most advanced actualization of that marriage. The coaches in Toronto helped the analytics team build the ghost system, and the analytics team sends the coaching staff regular e-mails with advanced numbers on upcoming opponents — e-mails the coaches read.

Coaches have also started using "points per possession" in conversations with players, and even tentatively passing along some tidbits from the cameras. The players think it's all sort of geeky — Kyle Lowry cackled when I asked DeRozan about them — but teams are going to learn all sorts of new things from this data, and teams that exploit that knowledge on the court will gain some advantages. Finding synergy between coaches and stats guys is a big piece of snagging those advantages, and that's going to be a tough process in some places. But the process has clear value.

"We're still just in the developmental phase," Rucker says of translating stats for coaches. "And things are much better than they were four years ago."

Link
 
I know you saw my guy Wilson's article last week, but 35 & 9 last night :pimp:

Always said he was better than Gallo when he was a Knick, finally proving me right. Hopefully he can keep this up!
 
He's having a pretty good stretch. Still as average as they come.

And not better than Gallinari.
 
Last edited:
Disagree. As average as they come is taking it a stupid.

Gallo is flat-footed, can't rebound, doesn't play D. The gulf between him and Chandler shooting is as wide as it is with rebounding/defense comparably. While I'm sure Chandler's numbers will regress somewhat, he is a guy who every year on the Knicks continued to make strides in his game. There are not too many guys his size who possess the capabilities that he does. Really, he was in China last season and has been hurt until recently, so really this is the first time as a Nugget we have seen him healthy and comfortable.

Gallo brings more to the table as an isolation scorer but the team also has to make up for his shortcomings consistently. You can pretty much throw Chandler on the court with whoever and he won't lose a step because his skill set is as wide as it is and adapts to uptempo or grind-it-out styles.

Plus, his facial expression literally never changes

View media item 321302
 
What was Value Added and EWA again?

I know it's wins added, based off stats, but do they use anything that actually includes other players, or actual wins/losses etc?

Dunno if you still have the question or not, but both of those are just 'above replacement' type metrics like WAR. Value added is expressed in terms of points contributed over the course of a season, and EWA in terms of wins. The basis of those metrics is just the difference in PER of a player over some fictitious 'replacement player.' I don't know the exact method of calculating the PER for the replacement player, but I believe it involves averaging data from a bunch of end-of-the-bench-type players. The crucial factor in the metric is that it uses minutes played to then calculate the VA. EWA is just derived from VA using some calculated estimate of how many points over the course of a season makes a win.

So the two statistics would be relevant in an MVP discussion - because obviously a player with a 21 PER playing 20 minutes a game isn't more 'valuable' than a player with a 20 PER playing 30.


That's a great article on SportVU posted on the previous page by PMatic. LeBron is such a freak :lol:
 
Last edited:
Disagree. As average as they come is taking it a stupid.

Gallo is flat-footed, can't rebound, doesn't play D. The gulf between him and Chandler shooting is as wide as it is with rebounding/defense comparably. While I'm sure Chandler's numbers will regress somewhat, he is a guy who every year on the Knicks continued to make strides in his game. There are not too many guys his size who possess the capabilities that he does. Really, he was in China last season and has been hurt until recently, so really this is the first time as a Nugget we have seen him healthy and comfortable.

Gallo brings more to the table as an isolation scorer but the team also has to make up for his shortcomings consistently. You can pretty much throw Chandler on the court with whoever and he won't lose a step because his skill set is as wide as it is and adapts to uptempo or grind-it-out styles.

Plus, his facial expression literally never changes

View media item 321302

Annnnnnnd with that, Chandler gets hurt last night. Nice work man.
 
Back
Top Bottom