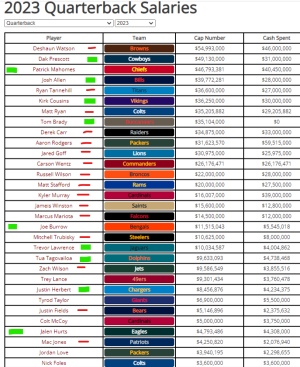
- 29,014
- 4,130
- Joined
- Jan 3, 2004
The one over the middle for the TD was even worse. When they showed the angle from behind Tom, I mean, the guy was RIGHT THERE. Tom threw it on a line, what did he think the guy was gonna do, duck?
Follow along with the video below to see how to install our site as a web app on your home screen.

Note: this_feature_currently_requires_accessing_site_using_safari
The one over the middle for the TD was even worse. When they showed the angle from behind Tom, I mean, the guy was RIGHT THERE. Tom threw it on a line, what did he think the guy was gonna do, duck?
Sad to see the decline of Thomas.

Question is, does he keep is word, since he's on the "decline". Which I think is BS to begin with.

Me too. Hopefully he retires soon and I can start seeing him around the neighborhood.
I dunno... I'm pretty okay with it the way it is.


Asking a jets fan on terms of QB evaluation ?

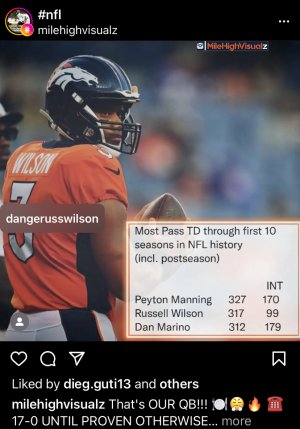
Andrew Luck tells @wingoz that he still uses his flip phone. Turns six years old this year
View media item 1201318
Such a weird dude...
Makes sense why he throws so many picks.

Fitz only has one more pick and a better record
Just saying
Tom isn't reading defenses tho either. He was hitting Chiefs in the hands.
Using a 2nd round pick on a QB was either truly genius, or truly stupid. Would think they could used another weapon, or lineman, etc.
Trading Mankins?
Lamar Miller ran all over the Chiefs, Ridley never even got a look.
And Alex Smith looked like Peyton out there.
Oakland looked like a JV team against us. It was 13-9 in NE, late before losin 16-9. Absurd.
Alllll bad for NE.
And Tom.
Owners of the 4 bottom spots in Completion % on passes 10+ yards: Brady, Manuel, Tannehill, Geno.
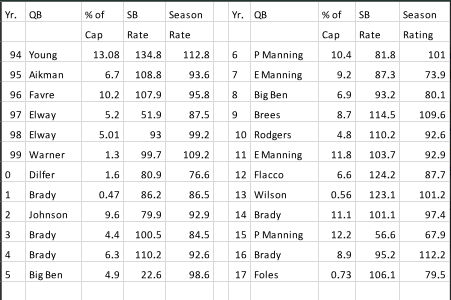
Welcome to “Complete QB,” a metric I’ve developed over the last five years. I designed this metric because I felt the vast majority of numbers and ratings out there were ineffective in their intent.
We’ve seen attempts come and go to try to measure and quantify quarterback production, but having gone over what it is that these measure, most are simply measurements of how efficient an entire offense is, or worse, complex formulas designed solely to validate pre-existing opinions.
I wanted to take bias and preconception out of it. I wanted to create something that measured the quarterback’s impact on the field, his complete impact; but how to do that and come up with a number that wasn’t interdependent on other variables such as how much time the QB had, how much was his wide receiver’s ability after the catch, etc?
While I won’t give you the complete formula, I will give you parts of the whole so you can understand why this number, I believe, has better merit than other numbers out there.
This number is based on hard data. There are no artificial limits, arbitrary modifiers, or any attempts from me to weight anything to conform to my own biases.
This number factors in a quarterback’s ability to run the ball as well as pass it.
This number takes into account a quarterback’s protection by factoring in average time to throw and its variance from the league average.
A quarterback’s efficiency isn’t affected by drops from his receivers in this metric.
A quarterback’s yardage isn’t inflated by screen pass after-the-catch yardage from his receiver, but he does get positive efficiency for completing the pass.
What I have created is a number that takes all of the positives and negatives a quarterback produces (to include lost yardage from delay of game or grounding penalties) and assesses overall impact to the team’s success.
I’ve included a couple of historical numbers to give context, and will add some more as time goes on.
The scale runs from zero to 200, with 110 to 125 suggesting the quarterback is in the bell curve in terms of how his performance and impact on the team stack up around the league. Anything below 110 suggests the quarterback is a liability to his team, with the degree or severity being gradually larger, the lower the number. A number over 130 suggests the quarterback is carrying his team to a degree.
Tim Tebow’s 2011 CQBR of 118 suggests when all factors are considered he wasn’t as bad as some of his detractors say, but he certainly isn’t the “key to winning” his proponents suggest either.
Peyton Manning’s CQBR from last year (2013 season) suggests that he was highly effective and productive, however, he was carried at times by his wide receivers making something after the catch.
Keep in mind all of the numbers for this season thus far are a small sample size of 4 games. Smaller sample size means the number is more variable in terms of season outlook, so if a player has had one bad or one extremely good game, the number will regress to the mean the longer the season carries on.
I want to thank Stats LLC and Pro Football Focus for their (unwitting) help with the raw data, both resources are great.
Historical Context
2011-Tebow 118.39
2013-P Manning 130.25
2006- M Vick 130.75
2007-V Young 108.01
2007 T Brady 141.05
2008- Ja Russell 70.91
Phillip Rivers 182.63
Joe Flacco 148.59
Andrew Luck 136.57
Colin Kaepernick 136.24
Matt Ryan 134.63
Aaron Rodgers 131.89
Blake Bortles 131.66
Tony Romo 131.51
Peyton Manning 131.36
Russell Wilson 127.44
Ryan Fitzpatrick 123.74
Drew Brees 120.08
Jay Cutler 119.11
Matthew Stafford 118.93
Alex Smith 118.77
Cam Newton 118.22
Ben Roethlisberger 115.7
Austin Davs 114.01
Eli Manning 112.02
Mike Glennon 111.93
Andy Dalton 110.54
Brian Hoyer 109.77
Kirk Cousins 108.96
Josh McCown 108.45
Derek Carr 104.11
Ryan Tannehill 104.01
EJ Manuel 102.09
Drew Stanton 101.95
Nick Foles 98.54
Geno Smith 98.31
Tom Brady 98.28
Jake Locker 98.25
Chad Henne 95.56
Matt Cassel 78.86
Cian Fahey @Cianaf 20s20 seconds ago
Luck converted 60 percent of behind the chains throws last week(Third-and-5+, Second-and-7+). 2013 NFL average = 30%