2016 MLB thread. THE CUBS HAVE BROKEN THE CURSE! Chicago Cubs are your 2016 World Series champions

Status
Not open for further replies.
Mets making Little League mistakes.
laugh.gif
Embarrassing.
 
How the League Adjusts to Hitters Over Time.
Spoiler [+]
Mets first baseman Ike Davis has seen the number of fastballs thrown to him drop significantly since his rookie season in 2010. In that year, 57% of the pitches thrown to Davis were some type of fastball. So far in 2012? Only 51%. There have been only 30 seasons between 2007 and 2011 where a hitter with more than 100 plate appearances saw a lower percentage of fastballs in a season than Ike this year — and only five where a player accumulated more than 500 plate appearances.

Clearly pitchers are adjusting to Davis, altering their approach based upon Davis’ perceived offensive strengths and weaknesses. This got me thinking about the extent to which major league pitchers adjust to hitters from year to year. Was this change significant, or more common based on the normal adjustments hitters can expect to see from year to year.

As a first cut, I decided to look at changes in the pitch types that batters faced in consecutive years. Throwing hitters a different mix of pitches (i.e. fastballs, curveballs, sliders, etc.) is just one way the league can adjust. Pitchers can alter location, sequence and speed. However, the data was more readily available for pitch types, so the choice was made to focus there first. I decided to use the pitch-type distributions that are based off of PITCHf/x data. This allowed me to collect data on hitters with 100 at least plate appearances each year from 2007 through 2011. For reference, here are pitches as classified by PITCHf/x:
[table][tr][th=""]Abbreviation[/th][th=""]Description[/th][/tr][tr][td]FA[/td][td]Four-seam Fastball[/td][/tr][tr][td]FT[/td][td]Two-seam Fastball[/td][/tr][tr][td]FC[/td][td]Cutter[/td][/tr][tr][td]FS/SI/SF[/td][td]Sinker, Split-fingered Fastball[/td][/tr][tr][td]SL[/td][td]Slider[/td][/tr][tr][td]CH[/td][td]Changeup[/td][/tr][tr][td]CU[/td][td]Curveball[/td][/tr][tr][td]KC[/td][td]Knuckle-curve[/td][/tr][/table]
Now, there are obviously some coding issues that come into play. PITCHf/x and the classification algorithms that it uses aren’t perfect and have changed a bit over the years. For example, it isn’t uncommon for sliders and cutters to be mistaken for each other. This is a problem, but not a fatal one as long as we acknowledge it up front. To get a first look I decided to group all fastballs together as this might alleviate some of the potential coding issues within the fastball category. The table below shows the results for all hitters with at least year-two data and for those with year-two and year-three data:
[table][tr][th=""]Sample[/th][th=""]N[/th][th=""]Fastball% YR1 to YR2[/th][th=""]Fastball% YR1 to YR3[/th][/tr][tr][td]All hitters with only two years of data[/td][td]142[/td][td].620**[/td][td]NA[/td][/tr][tr][td]All hitters with at least three years of data[/td][td]367[/td][td].586**[/td][td].519**[/td][/tr][tr][td]**Sig at the .01 level[/td][td][/td][td][/td][td][/td][/tr][/table]
For hitters with only two years worth of data, we see a highly significant correlation between the percent of fastballs seen (.620). The correlation drops a bit, to .586, for hitters with three years of data. Additionally — for hitters with three years of data — we see that the relationship decreases further once we get to that third year. This likely reflects the fact that hitters who only managed to accumulate at least 100 plate appearances in two consecutive years were lesser hitters and, therefore, required less adjustment from the league. These hitters eventually drop out of the sample and we’re left with hitters who perform well enough to require additional approach changes from opposing pitchers. The sample above includes all hitters, but is there a difference between established hitters who have major league track records and rookies who haven’t accumulated a significant number of plate appearances? My initial hypothesis was, yes, we should see a greater adjustment by the league in terms of rookies versus players who have already established their habits and tendencies. To test this I calculated separate correlations for hitters whose first season in the sample was their first with at least 100 plate appearances. Here are the results for hitters with two years of data, compared to those with three years:
[table][tr][th=""]Sample[/th][th=""]N[/th][th=""]Fastball% YR1 to YR2[/th][th=""]Fastball% YR1 to YR3[/th][/tr][tr][td]Non-rookies with only two years of data[/td][td]88[/td][td].569**[/td][td]NA[/td][/tr][tr][td]Rookies with at least two years of data[/td][td]54[/td][td].710**[/td][td]NA[/td][/tr][tr][td]Non-rookies with at least three years of data[/td][td]291[/td][td].575**[/td][td].527**[/td][/tr][tr][td]Rookies with at least three years of data[/td][td]76[/td][td].633**[/td][td].508**[/td][/tr][tr][td]**Sig at the .01 level[/td][td][/td][td][/td][td][/td][/tr][/table]
Contrary to what I expected, the league feeds rookies a similar percentage of fastballs between year one and year two than for non-rookies, regardless of which sample we look at. But the adjustment from the first year to the third year is much larger for those who were rookie hitters. My guess here is that pitchers need more than the first year’s worth of plate appearances to update their approaches. The average number of plate appearances in players’ rookie years was 359, compared to 418 in the second season and 450 in the third. For non-rookies, the average plate appearances were 404, 405 and 438. And if we assume that year one in the data set for non-rookies is at least their second year in the league, we can assume that the league as on average 763 plate appearances to refer to for non-rookies going into year two, 112% more than for rookies. (Remember, year one in my data set isn’t the first season in the league for non-rookies, just the first season in the data set. That means pitchers have had a longer look at those hitters than rookies.)

I should also note, though, that the differences observed rookies and non-rookies were not clearly significant. If you compare the correlations for each category, the closest we come is between rookies and non-rookies with only two years of data (p-value of .087). For rookies and non-rookies with three years worth of data the p-value was .24. And what about off-speed offerings? Obviously, if the fastball percentages are fluctuating yearly, we should see changes in off-speed percentages. For that, I decided to use the specific pitch-type categories — rather than a composite. The table below shows correlations for sliders, curveballs and changeups for all hitters with data for only years one and two, as well as those with data for all three years:
[table][tr][th=""][/th][th=""]N[/th][th=""]YR1 to YR2[/th][th=""]YR1 to YR3[/th][/tr][tr][td]SL% (pfx) – two years only[/td][td]142[/td][td].499**[/td][td]NA[/td][/tr][tr][td]SL% (pfx) – three years[/td][td]367[/td][td].673**[/td][td].663**[/td][/tr][tr][td]CU% (pfx) – two years only[/td][td]142[/td][td].335**[/td][td]NA[/td][/tr][tr][td]CU% (pfx) – three years[/td][td]366[/td][td].363**[/td][td].240**[/td][/tr][tr][td]CH% (pfx) – two years only[/td][td]142[/td][td].650**[/td][td]NA[/td][/tr][tr][td]CH% (pfx) – three years[/td][td]367[/td][td].595**[/td][td].541**[/td][/tr][tr][td]**Sig at the .01 level[/td][td][/td][td][/td][td][/td][/tr][/table]
At first glance, sliders and changeups pop as the most consistent off-speed offerings that hitters face each year. Sliders in years one and two have a .673 correlation, and the correlation between years one and three is only slightly different (.663). Changeups also show a fairly strong consistency, even three years out. Curveballs, however, start with a low correlation (.363) and get even less consistent by year three (.240). As with fastballs, I wondered whether there would be a difference between rookies and non-rookies. Here are the results:
[table][tr][th=""][/th][th=""]N[/th][th=""]YR1 to YR2[/th][th=""]YR1 to YR3[/th][/tr][tr][td]SL% (pfx) – Rookies[/td][td]76[/td][td].726**[/td][td].650**[/td][/tr][tr][td]SL% (pfx) – Non-rookies[/td][td]291[/td][td].660**[/td][td].669**[/td][/tr][tr][td]CU% (pfx) – Rookies[/td][td]76[/td][td].216[/td][td].343**[/td][/tr][tr][td]CU% (pfx) – Non-rookies[/td][td]290[/td][td].405**[/td][td].215**[/td][/tr][tr][td]CH% (pfx) – Rookies[/td][td]76[/td][td].577**[/td][td].600**[/td][/tr][tr][td]CH% (pfx) – Non-rookies[/td][td]291[/td][td].599**[/td][td].531**[/td][/tr][tr][td]**Sig at the .01 level[/td][td][/td][td][/td][td][/td][/tr][/table]
Outside of sliders, non-rookies showed a higher correlation between the off-speed pitches they faced between years one and two. Sliders were highly correlated for rookies between years one and two (.726); the relationship between year one sliders and year three sliders for non-rookies was nearly identical (.669 vs. .660). Curveballs were inconsistent regardless of hitter type. Rookies also saw their year-three correlations increase for both curves and changeups, versus year-two. Both were higher than non-rookies.

As with fastballs, I wanted to see if the difference between the rookie and non-rookie correlations was significant. It was but only in the case of curveballs between years one and two (p-vale of .05).

There are a factors that likely impact the data and patterns we see. One of those factors is age. The percent of fastballs faced increases in a fairly linear fashion as batters age. This increase corresponds somewhat to hitters’ run-creation ability as they age. Take a look at the graph below:


The percent of fastballs faced increases slightly until about age 26. Pitchers then throw hitters fewer fastballs until about age 30. The rate then increases dramatically as hitters age. If we think about a hitter’s productivity through time then this makes sense. Hitters who last until age 30 are likely better-than-average and will have hit their offensive peak during their age-25 through age-29 seasons. As these hitters begin to age, they’re likely losing bat speed and making pitchers throw them more fastballs. There are obviously exceptions, but the pattern passes the initial sniff test.

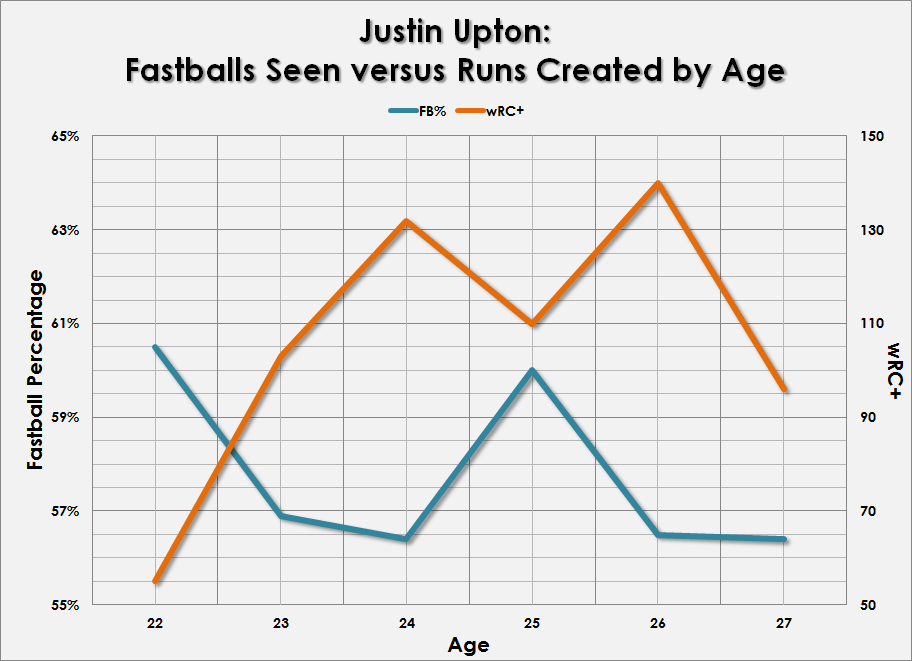
As an example, here is Justin Upton‘s fastball percentage versus his wRC+ since 2007:


The pattern resembles the story above. As Justin Upton entered his peak offensive year, he saw a decrease in the percentage of fastballs thrown to him. So far this season, he’s seen fewer fastballs — and while his wRC+ is currently below average, my guess is he’ll finish his age-27 season north of 100.

So back to my original question about Ike Davis: Is the change in the percentage of fastballs he’s seeing that uncommon? The answer appears to be no.

While the low rate of fastballs is rather unique, the way in which the league adjusted to him between years one, two and three is in line with what we see in general. Rookies see a higher correlation between their year-one and year-two fastballs and less of a correlation between years one and three. Davis’ percent of fastballs seen has been 56.8%, 56.7% and 51.4%. Also, the 5%+ decline in fastballs seen is far from an outlier, as there have been 69 seasons where hitters saw the same or greater decline in fastball percentage since 2007, not including Davis.

Obviously, there is more to adjustments than pitch-type distributions. I’ll eventually get a chance to look at location and velocity, but if PITCHf/x and database-savvy readers want to tackle this, please jump in.


Injuries Mounting for the Red Sox.
Spoiler [+]
The injuries keep coming for the Boston Red Sox. The most recent victim is off-season acquisition Cody Ross, who is out indefinitely with a fractured bone in his foot. With Ross now on the disabled list, all three of the Red Sox projected starters in the outfield are currently injured. While the Red Sox have struggled this season, they are only 6.5 games out of first place. But the injuries will make it difficult to close the gap.

The fact that the Red Sox are only 6.5 games out is truly amazing considering all the injuries they’ve already been dealt. Carl Crawford has yet to play a single game for the team this season, and Jacoby Ellsbury lasted just seven games before injuring his shoulder. With Ross now injured, the team will have to get by with some combination of Ryan Sweeney, Daniel Nava, Marlon Byrd and Che-Hsuan Lin in the outfield.

While an injury to Ross wouldn’t typically be reason for panic, the Red Sox had high expectations for him this season. Even though Ross came in with a spotty track record, he got off to a pretty good start. With the Red Sox already experiencing injuries to other players, Ross kept the team afloat. Before his injury, Ross rated as the fourth best offensive player on the team.

His performance was somewhat surprising, considering Ross has been a useful — but never great — player throughout his career. Over the past five seasons, Ross has accumulated 11.1 WAR, putting him in the same category as Aaron Rowand, Mike Cameron and Kevin Kouzmanoff. That’s hardly the type of player who should become a premier acquisition for a club. But it was a strange off-season for the Red Sox, and Ross looked like the team’s best offensive addition this year.

Ross’ injury only complicates how we should look at the Red Sox’s off-season. Many of the players they acquired — Ross, Andrew Bailey and Mark Melancon — have disappointed this year. Bailey has yet to play a game for the team, and Melancon gave up 11 runs in 2.0 innings before being sent down to Triple-A. But while the more heralded players have failed to contribute, the team is being held together by some of their more shrewd moves this off-season.

The decision to trade away both Marco Scutaro and Jed Lowrie was met with a lot of criticism, but Mike Aviles has filled in admirably in their absence. Aviles’ 1.7 WAR leads the team this year, and while it’s highly unlikely that he’ll keep up the pace, the decision to go with Aviles has paid off early on.

The same can be said of Ryan Sweeney, who wasn’t expected to play as big a role after he was acquired. But injuries have forced Sweeney into a more prominent role, and he’s responded well. While his offensive production is unsustainable going forward, he should be able to provide solid defense in any spot while Crawford, Ellsbury, Ross and Ryan Kalish recover.

With Ross out, Sweeney and Aviles will have to step up even more. Unfortunately, neither player is capable of performing at a much higher rate. For all the grief the team has received about their less-than-stellar off-season, they’ve also made some shrewd acquisitions that have kept them within striking distance. But without a major signing this year, the team doesn’t have the depth to handle all of their injuries. But with another significant injury, the team is quickly running out of depth. Ross’ injury wouldn’t normally be viewed as such a big deal, but the Red Sox couldn’t afford to lose anyone else. Unless Crawford and Ellsbury can make miraculous recoveries, the team is going to need a lot of luck if they want to get back in the race.


Max Scherzer Strikes Out 15, All Swinging.
Spoiler [+]
It’s been a strange season for Detroit Tigers stater Max Scherzer and its only the third week of May. Well, maybe strange is too strong of a word. Perhaps interesting is a better choice. And it certainly has been interesting.

Scherzer’s first start of the season, on April 8 against the Boston Red Sox, ended after only 2 2/3 innings. The righty gave up seven runs on eight hits and two walks and was pulled before the end of the third inning. Of his 80 pitches, there were 51 strikes — 16 called strikes and four swing-throughs. The other 31 strikes were either hits or foul balls. Velocity didn’t appear to be an issue. His fastball averaged 93.5 mph, his two-seamer averaged 94.6, his slider averaged 86.6 and his change-up averaged 85.1 — all faster speeds than he recorded on average in 2011.  But he threw too many pitches over the heart of the plate, resulting in hits and runs.


Fast forward to Sunday’s game between the Tigers and the Pittsburgh Pirates at Comerica Park. Scherzer was on the mound for the Tigers for his ninth start of the season — sporting a 2-3 record and a 4.37 FIP. At the same time, Scherzer had a 10.1 K/9 rate, the highest of his career. It was a sign of things to come.

Scherzer threw nine pitches in the first inning, all strikes. Jose Tabata led off the game with a fly ball to right field. Then Neil Walker and Andrew McCutchen struck out, both swinging. Pedro Alvarez saw the first ball thrown by Scherzer, in the second inning, but struck out on four pitches, swinging. Garrett Jones hit a double, but Scherzer stranded him with a foul pop fly and a strikeout of Rod Barajas, swinging.

There were two more swinging strikeouts in the third inning, three more in the fourth and three more in the fifth. Through five innings, the only blemish for Scherzer was a solo home run from Rod Barajas. Jhonny Peralta tied the score for the Tigers with a solo shot of his own in the bottom of the fifth, but Scherzer gave back the lead again, giving up a solo homer to Neil Walker in the sixth. Oh, and two more swinging strikeouts — for a total of 14 strikeouts in six innings. That tied his career best.

But the pitch count was rising, hitting 102 at the end of the sixth inning. Still, Scherzer was back on the mound for the 7th, recording his 15th strikeout of the day off Josh Harrison and then getting Rod Barajas and Nate McLouth to fly out. The strikeout of Harrison was swinging, of course.

After the Tigers rallied to take a 4-2 lead in the bottom of the seventh, Scherzer’s day was done: 115 pitches and 80 strikes. Forty-two strikes were by contact, 21 by swing-throughs and 17 as called by the home-plate umpire. Like his first start of the year in early April, Scherzer had excellent velocity on all four of his pitches. He averaged 94.6 mph on his four-seam fastball, 94.2 on his two-seamer, 86.3 on his slider and 86.7 on his change-up. But unlike his first start, Scherzer did a much better job locating his pitches up in the zone, down in the zone and on the corners.


Scherzer is the first pitcher in the majors this season to record 15 strikeouts in a game. Cliff Lee struck out 16 in a game last season. Jered Weaver struck out 15, also last season. According to STATS LLC, the last pitcher to record 15 strikeouts in a game, all by swinging, was Mike Scott of the Houston Astros, which came against the Cincinnati Reds on June 8, 1990.

Scherzer’s current 11.65 K/9 leads all major league pitchers this season. His next best season was 2009 — when he posted a 9.19 K/9 rate — which was good for 10th best in the league. If he keeps this up, perhaps he can hit 17 in game, which Brandon Morrow accomplished in 2010; or Scherzer could reach 18, which Ben Sheets did in 2004.

Aroldis Chapman, Official Closer.

Spoiler [+]
Yesterday, the transformation from setup man to closer came full circle for Aroldis Chapman, as he protected a three-run lead for the Reds in earning his second career save. With the move, Sean Marshall has been consigned back to his former role of setup man. Marshall’s early failures however, don’t mean that he doesn’t have closer’s stuff.

The last straw for Marshall came on Saturday. Brought on to protect a similar three-run lead against the Bombers, Marshall allowed four of the five batters he faced to reach base, and allowed the potential tying and winning runs to reach base. Since Chapman had already pitched at this point, Jose Arredondo was brought in to clean up for Marshall, and clean up he did, as the Reds won. Still, the meltdown led Reds manager Dusty Baker to make the switch on Sunday. Yet, while Marshall did not serve in the closer’s role on Sunday, he was inserted for the Reds’ highest-leverage plate appearance of the game when he struck out Robinson Cano in the bottom of the eighth, proof that Baker still has faith in him. And really, there isn’t any reason not to.

Marshall’s Saturday meltdown was his fourth of the season, which may seem like a high number, but really isn’t when you scan the leaderboards. Marshall is just one of 22 relievers to suffer four meltdowns this season, and 18 pitchers have had more than four. Is it on the low end of the spectrum? Sure, but it’d be a stretch to say that those four meltdowns preclude Marshall from ever succeeding as a closer in the future. The pitcher that the Reds signed to close this season — Ryan Madson — had between seven and 16 meltdowns every season from 2004-2010 before adorning the scarlet “C
 
Ryan Zimmerman might be more fragile than David Wright, scratched from the lineup 45 minutes before first pitch..
 
That Zimmerman/Rendon combo and where they decide to play em is gonna be interesting down the road. Zimmerman's fragility and Rendon's terrible ankles
30t6p3b.gif
 
Brian Roberts to begin a conditioning assignment in AA Bowie....

Not sure what's gonna happen w/ him, but that's a great first step.
 
Originally Posted by madj55

Ryan Zimmerman might be more fragile than David Wright, scratched from the lineup 45 minutes before first pitch..
Huh? David Wright only had real injury problems last year he has played 140 games every year of his career aside from that.

I remember when people on here swore to me Zimmerman was better than David
laugh.gif
 
Originally Posted by airmaxpenny1

Originally Posted by madj55

Ryan Zimmerman might be more fragile than David Wright, scratched from the lineup 45 minutes before first pitch..
Huh? David Wright only had real injury problems last year he has played 140 games every year of his career aside from that.

I remember when people on here swore to me Zimmerman was better than David
laugh.gif
Zimmerman has been better for three consecutive seasons up until this one, and has yet to hit his prime. Not exactly outrageously hilarious to have called him better. 
So good to see Matusz have an excellent start, and aggressively command the strike zone like that. Hopefully he can build on it. 
pimp.gif


LOL @ Jimenez having more walks than strikeouts. That trade screamed high risk from the get go. Nice to see the Tribe doing well in spite of him, though. 
 
Originally Posted by airmaxpenny1

Originally Posted by madj55

Ryan Zimmerman might be more fragile than David Wright, scratched from the lineup 45 minutes before first pitch..
Huh? David Wright only had real injury problems last year he has played 140 games every year of his career aside from that.

I remember when people on here swore to me Zimmerman was better than David
laugh.gif
Wow didn't realize that, seemed to me that whenever we played the Mets that Wright wasn't on the field. And I still believe that Zimmerman is better than Wright.
 
Originally Posted by Kevin Cleveland

I'm about ready to see him get traded for Peter Bourjos straight up.
laugh.gif


-Another 9 K's for Gio, dude is absolutely dominating NL hitters. That hammer�
sick.gif


Edit: Not sure how long it'll last on youtube, but I thought I'd share this vid - was linked through espn. This at-bat may well have been the zenith of the steroids era.
roll.gif


Not the biggest Gio fan but it's nice to see he's cut down on the walks and has been better finding/controlling the zone. Dominating right now. Needs to start going a little deeper in starts though IMO.

And Zimmerman has been better than Wright
laugh.gif
his all around game is better.
 
Originally Posted by abovelegit1

Originally Posted by Kevin Cleveland

I'm about ready to see him get traded for Peter Bourjos straight up.
laugh.gif


-Another 9 K's for Gio, dude is absolutely dominating NL hitters. That hammer�
sick.gif


Edit: Not sure how long it'll last on youtube, but I thought I'd share this vid - was linked through espn. This at-bat may well have been the zenith of the steroids era.
roll.gif


Forgot about Gagne. Barry turning on 101 mph and putting it into the water foul 
laugh.gif

I miss that though, bring steroids back. Not enough runs.
 
DoubleJs07 wrote:
Brian Roberts to begin a conditioning assignment in AA Bowie....

Not sure what's gonna happen w/ him, but that's a great first step.
I still don't understand how he, Justin Morneau, & Sydney Crosby missed so much time & had so much trouble post concussion & NFL players can come back either the following week or only miss 1 week. It's a shame too because B Rob was on his way to being a star. Hope he comes back strong. 

Anyone else feel sorry for King Felix toiling away in Seattle? Dude is having a monster career & no one knows about it. The team isn't going anywhere either. Shame about him & Ichiro (even though he's not having the best year)...


Wright is the far better player, he just had a rocky comeback after getting beaned a few years back plus the transition to Citi.  David's resume is far better and is showing when he's healthy its not really an argument.
 
Originally Posted by psk2310

DoubleJs07 wrote:
Brian Roberts to begin a conditioning assignment in AA Bowie....

Not sure what's gonna happen w/ him, but that's a great first step.
I still don't understand how he, Justin Morneau, & Sydney Crosby missed so much time & had so much trouble post concussion & NFL players can come back either the following week or only miss 1 week. It's a shame too because B Rob was on his way to being a star. Hope he comes back strong. 

Anyone else feel sorry for King Felix toiling away in Seattle? Dude is having a monster career & no one knows about it. The team isn't going anywhere either. Shame about him & Ichiro (even though he's not having the best year)...

  
laugh.gif
at both comments...
Roberts was one of the top 3 2B when he got hurt, + every concussion is different.
Ichiro came into the league and won 116 games, Seattle just got stuck in a rebuilding period, and Felix is the sheep who bought in
 
laugh.gif
ok, you wanna believe that Wright is by far the better player then so be it. I love how when things are going well, relationships are all of a sudden at their peak with players.

I wouldn't say Seattle got stuck in a rebuilding period, they just gave out horrible contracts and thought it was wise to build a team around Ichiro. Speaking of that 116 team, Bret Boone's #'s those years were crazy
laugh.gif
 
Originally Posted by gangsta207therevolution

Originally Posted by psk2310

DoubleJs07 wrote:
Brian Roberts to begin a conditioning assignment in AA Bowie....

Not sure what's gonna happen w/ him, but that's a great first step.
I still don't understand how he, Justin Morneau, & Sydney Crosby missed so much time & had so much trouble post concussion & NFL players can come back either the following week or only miss 1 week. It's a shame too because B Rob was on his way to being a star. Hope he comes back strong. 

Anyone else feel sorry for King Felix toiling away in Seattle? Dude is having a monster career & no one knows about it. The team isn't going anywhere either. Shame about him & Ichiro (even though he's not having the best year)...

  
laugh.gif
at both comments...
Roberts was one of the top 3 2B when he got hurt, + every concussion is different.
Ichiro came into the league and won 116 games, Seattle just got stuck in a rebuilding period, and Felix is the sheep who bought in


laugh.gif
 at you mentioning the 116 win season, that was over 10 years ago. They haven't done squat since then which is a shame because Ichiro & Felix are great players to watch. You are right about B Rob though, which is why I was saying he was on his way to being a possible star (star & top player being two different things).

laugh.gif
laugh.gif
 at your concussion comment. Yes they are all different, but NFL players should not be allowed to come back so soon. I guess you don't realize football is much more violent that baseball. Hockey & football are comparable so the fact that Crobsy missed so much time post concussion should say something about the NFL policies.
 
Status
Not open for further replies.
Back
Top Bottom